UNRAID UPS Monitoring
UPS monitoring with Prometheus and apcupsd exporter. Check this guide to learn how to setup this. toino.net/unraid-ups-monitoring-with-prometheus-and-grafana/
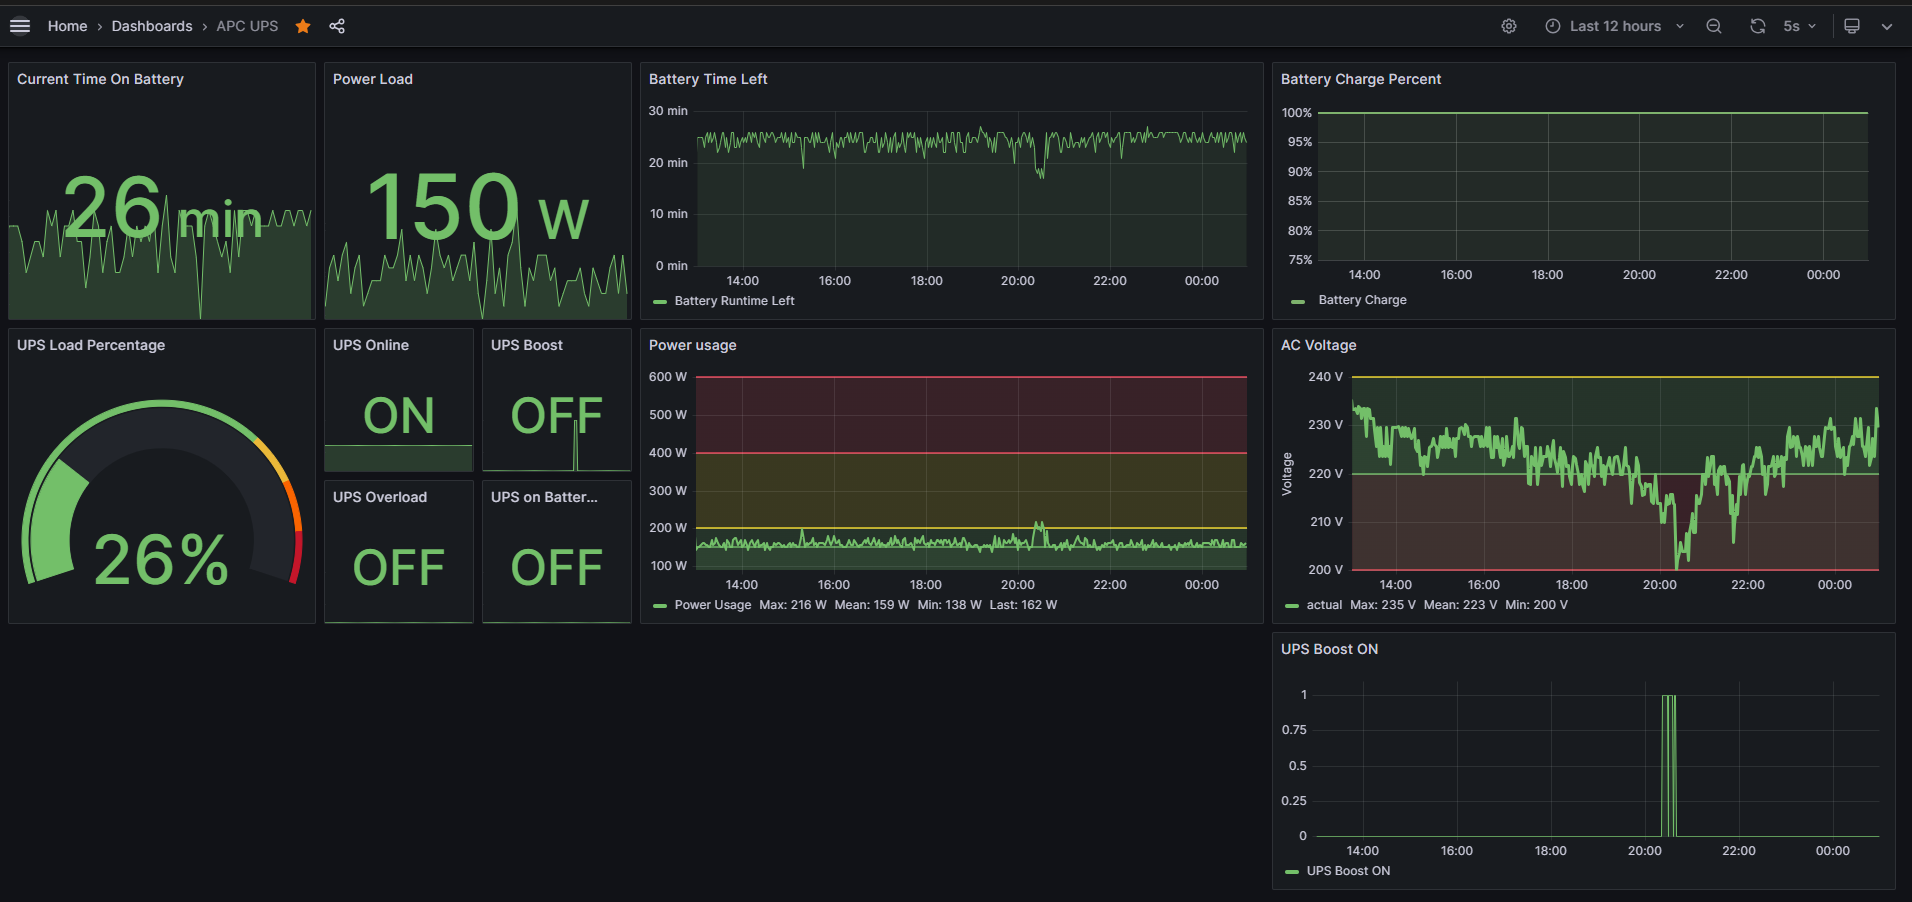
The UNRAID UPS Monitoring dashboard uses the prometheus data source to create a Grafana dashboard with the gauge, graph, stat and timeseries panels.
Data source config
Collector type:
Collector plugins:
Collector config:
Revisions
Upload an updated version of an exported dashboard.json file from Grafana
| Revision | Description | Created | |
|---|---|---|---|
| Download |