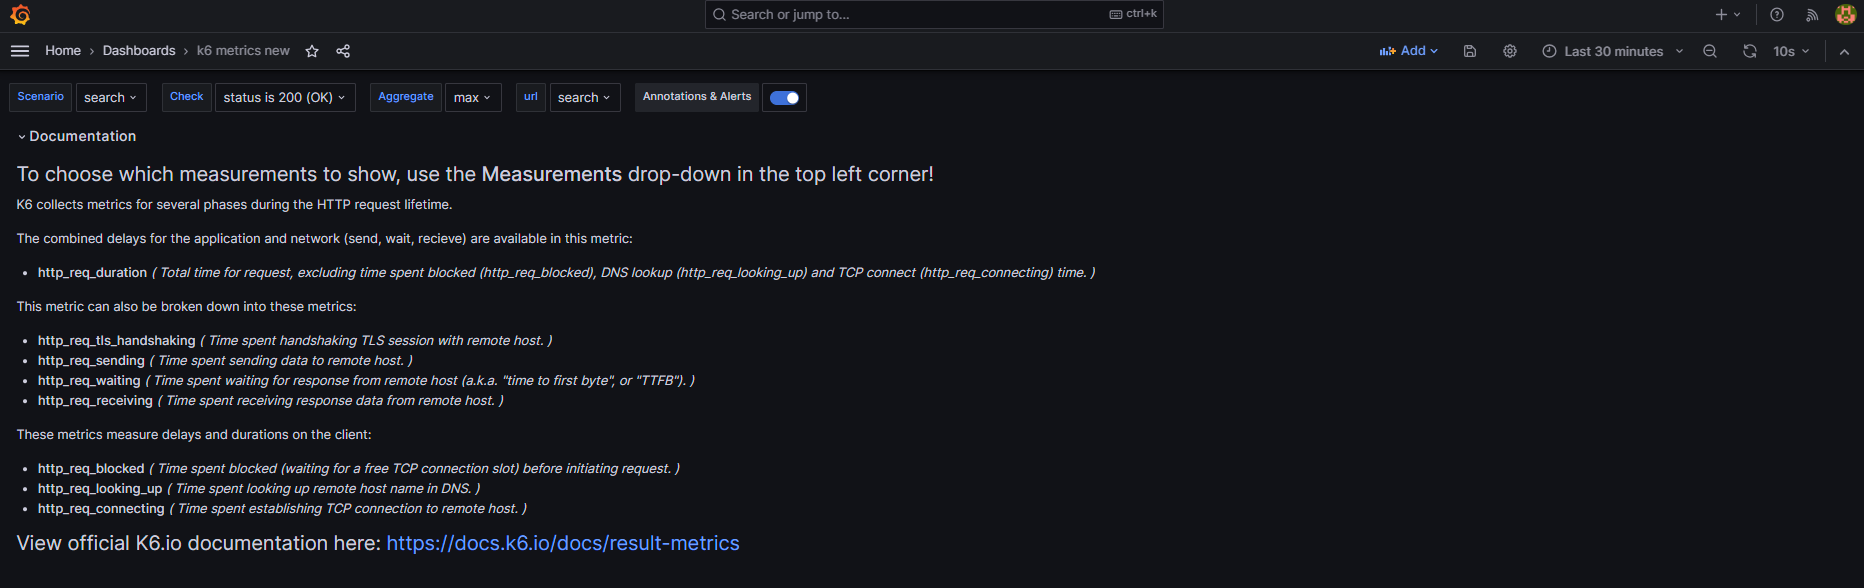
k6 metrics
A dashboard for visualizing results from the k6.io load testing tool, using the InfluxDB exporter and loki logs
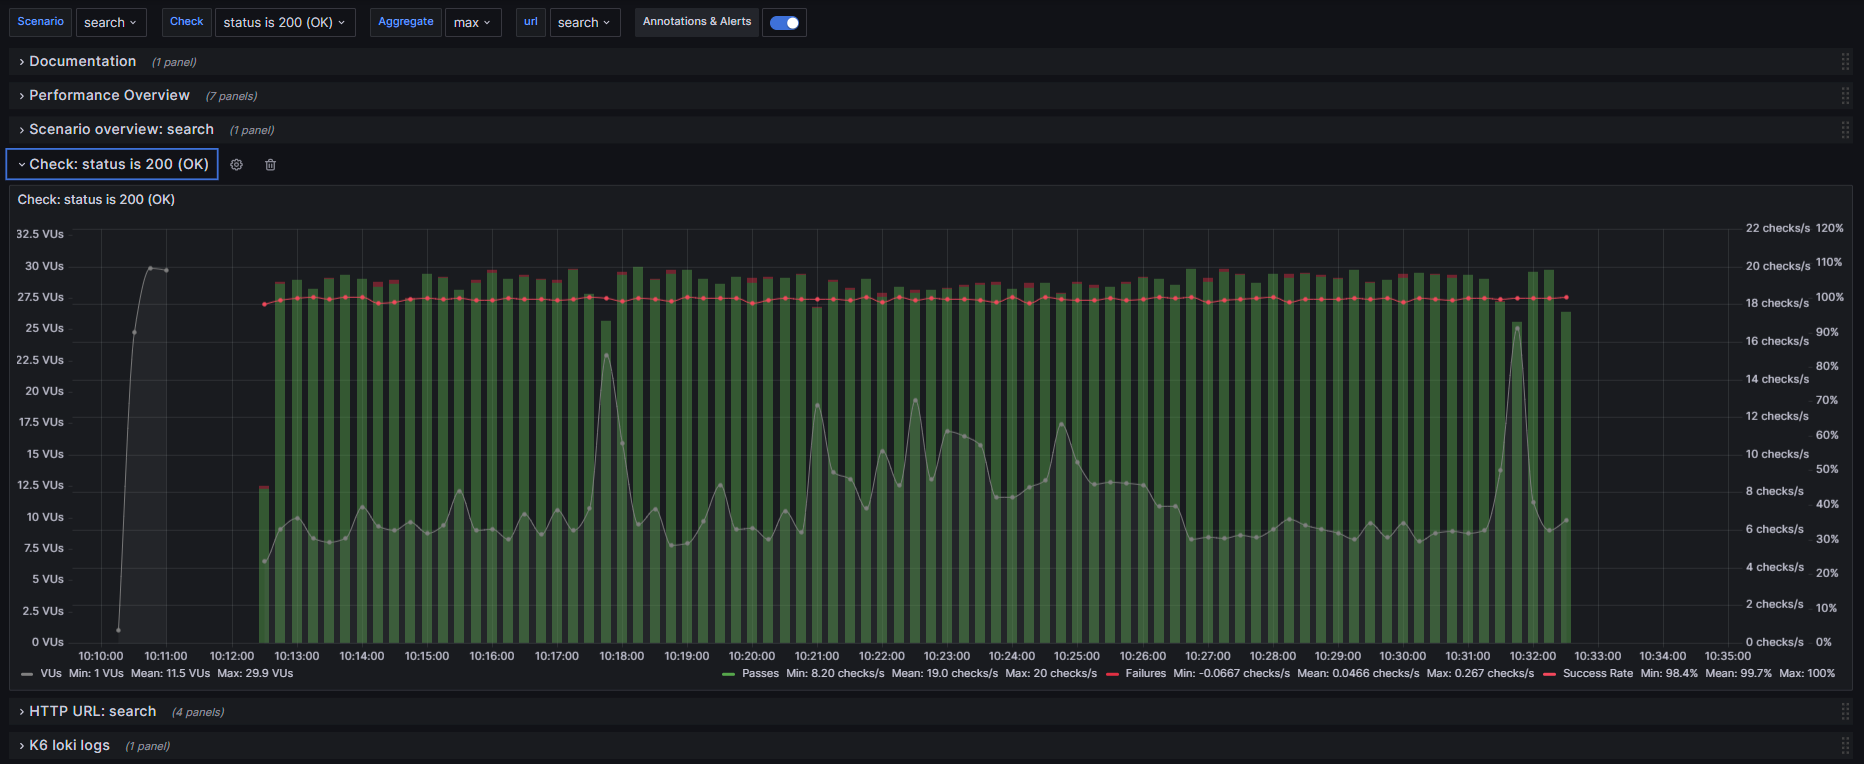
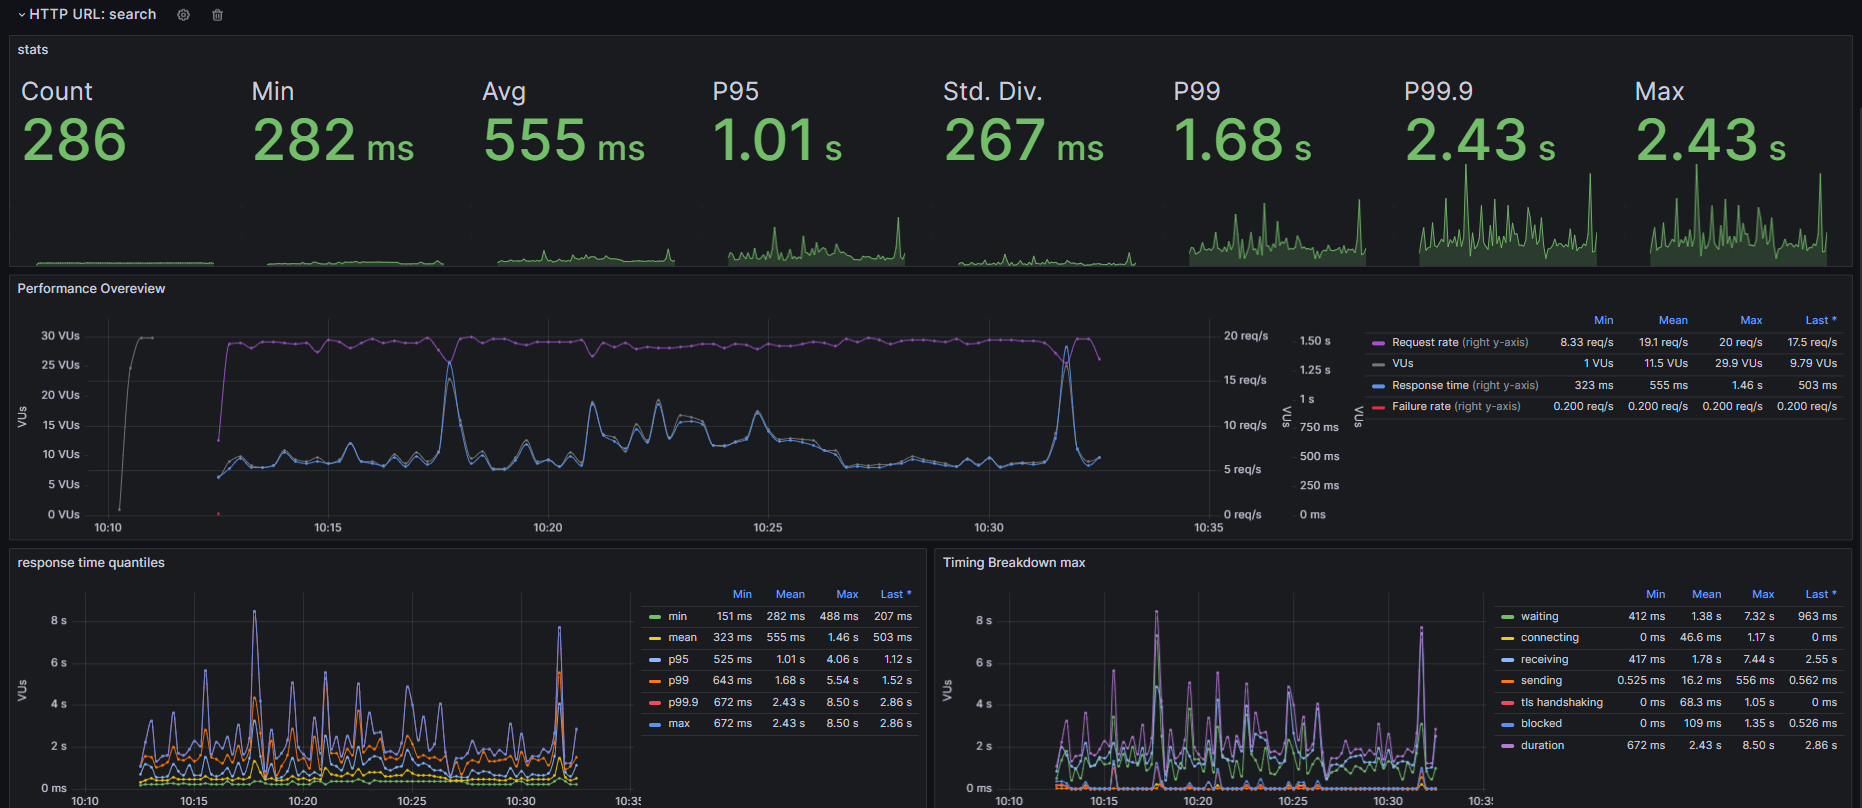
This board uses InfluxDB (version <2) and Loki to monitor load tests conducted using K6. The board allows to work with multiple scenarios and checks. It is also possible to aggregate the values on the board using a selector for min,mean,max,p50,p75,p95,p99 and p99.9.
The board was inspired by the K6 Grafana cloud solution.
Data source config
Collector type:
Collector plugins:
Collector config:
Revisions
Upload an updated version of an exported dashboard.json file from Grafana
| Revision | Description | Created | |
|---|---|---|---|
| Download |