z/VM SSI Overview
The dashboard is useful for customer using z/VM® Single System Image.
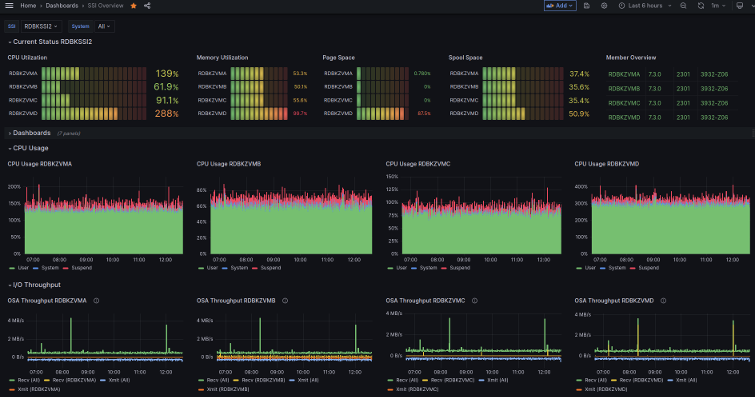
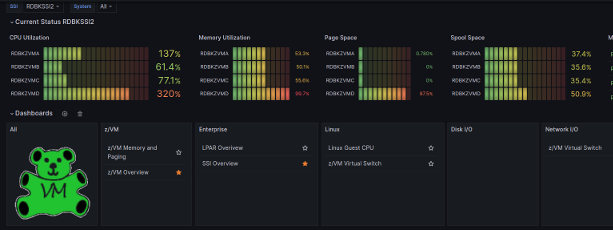
The dashboard is useful for customer using z/VM® Single System Image. A single dashboard shows key aspects like CPU and memory utilization of one or more systems in one place in comparison to each other as well as individual trend over time. The dashboard is effective as "home dashboard" as it provides a good overview of the entire SSI and helps navigating to other dashboards. When running in SSI, the default configuration of z/VM Performance Data Pump collects the metrics used for this dashboard.
For those who prefer a diverging (positive/negative) axis view, you can invert one metric—such as transmit traffic—by adding a negative sign in the query (for example, multiply the value by -1). This allows receive and transmit values to appear on opposite sides of the axis, recreating the traditional split-visualization style.
This dashboard is licensed by IBM under the Apache 2.0 License and is provided ‘as is’ without warranty, representation, support, maintenance or an obligation to issue updates.
Data source config
Collector config:
Upload an updated version of an exported dashboard.json file from Grafana
| Revision | Description | Created | |
|---|---|---|---|
| Download |