z/VM CPU Cache Metrics
The dashboard shows detailed metrics about CPU cache miss ratio, cycles per instruction, memory references, and Relative Nest Intensity.
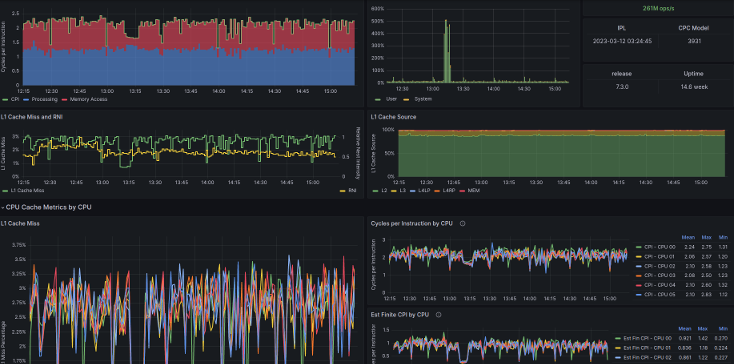
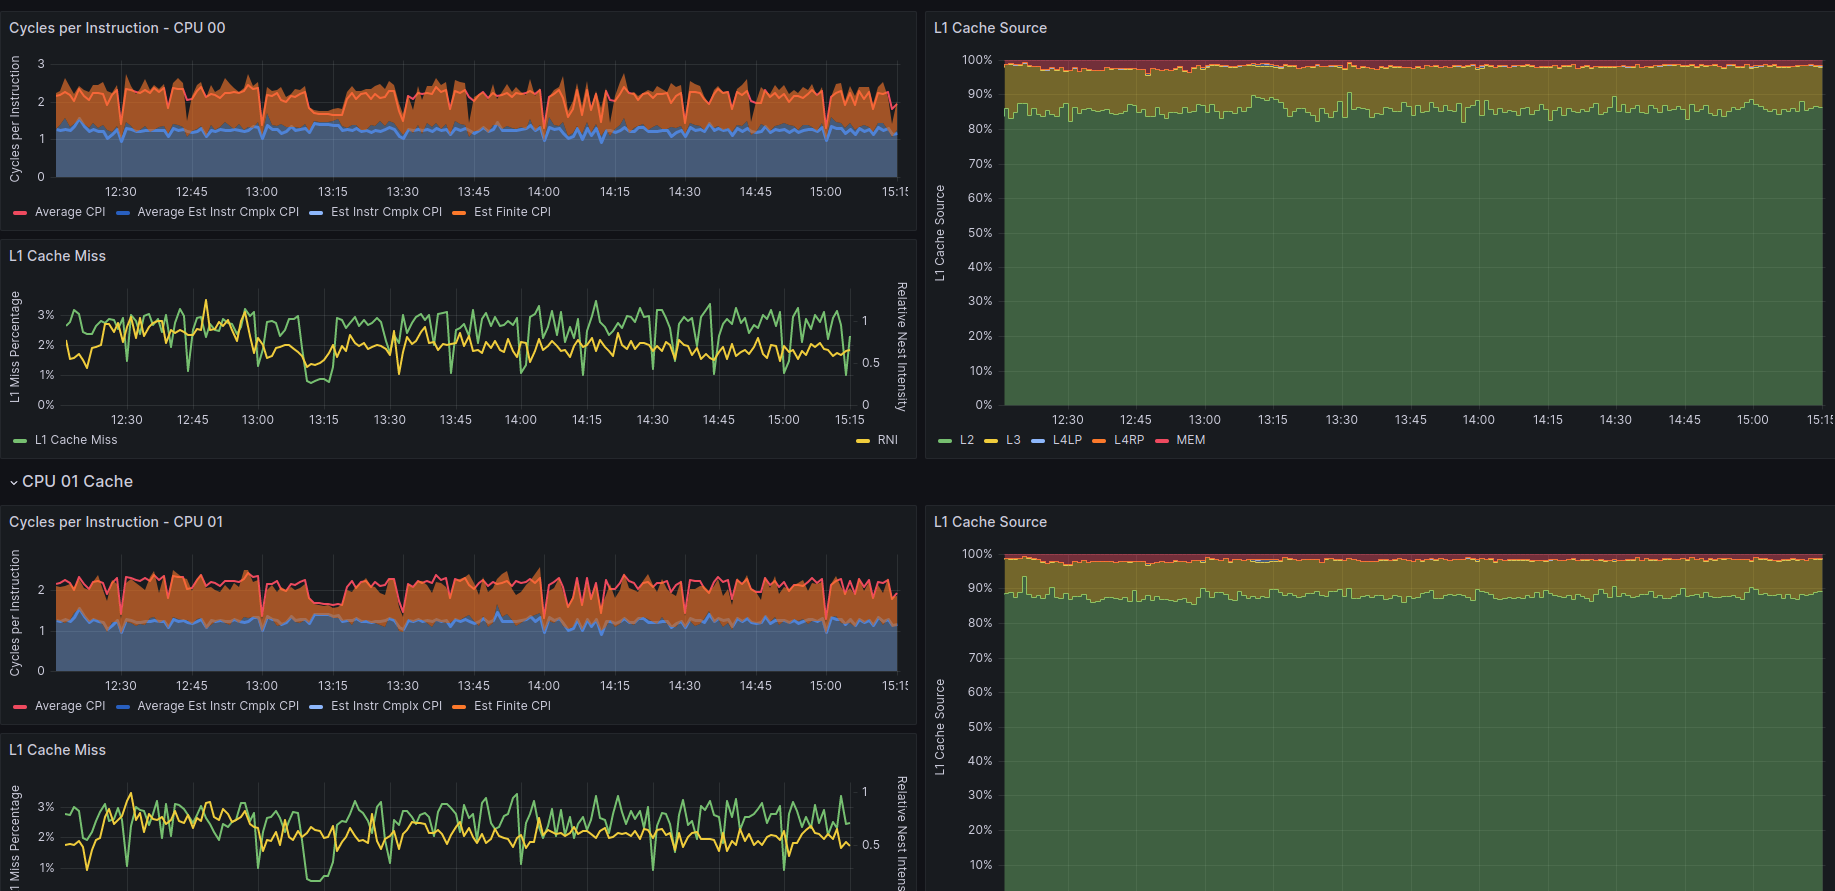
The dashboard shows detailed metrics about CPU cache miss ratio, cycles per instruction, memory references, and Relative Nest Intensity. The data helps understand how efficient the workload runs in this configuration. Charts are provided as overall average and per logical CPU of the z/VM® system.
The data to populate the dashboard is only available when Performance Data Collection is enabled in the profile of the logical partition. This is visible in the output of QUERY MONITOR SAMPLE as CPUMFC (rather than NOCPUMFC). When available, the data is extracted by the default configuration of the Data Pump.
This dashboard is licensed by IBM under the Apache 2.0 License and is provided ‘as is’ without warranty, representation, support, maintenance or an obligation to issue updates.
Data source config
Collector config:
Upload an updated version of an exported dashboard.json file from Grafana
| Revision | Description | Created | |
|---|---|---|---|
| Download |
Varnish Cache
Easily monitor Varnish Cache, an open source web application accelerator, with Grafana Cloud's out-of-the-box monitoring solution.
Learn more