Spring Boot 3.x Statistics
Spring Boot Dashboard adapted from https://grafana.com/grafana/dashboards/10280-microservices-spring-boot-2-1/
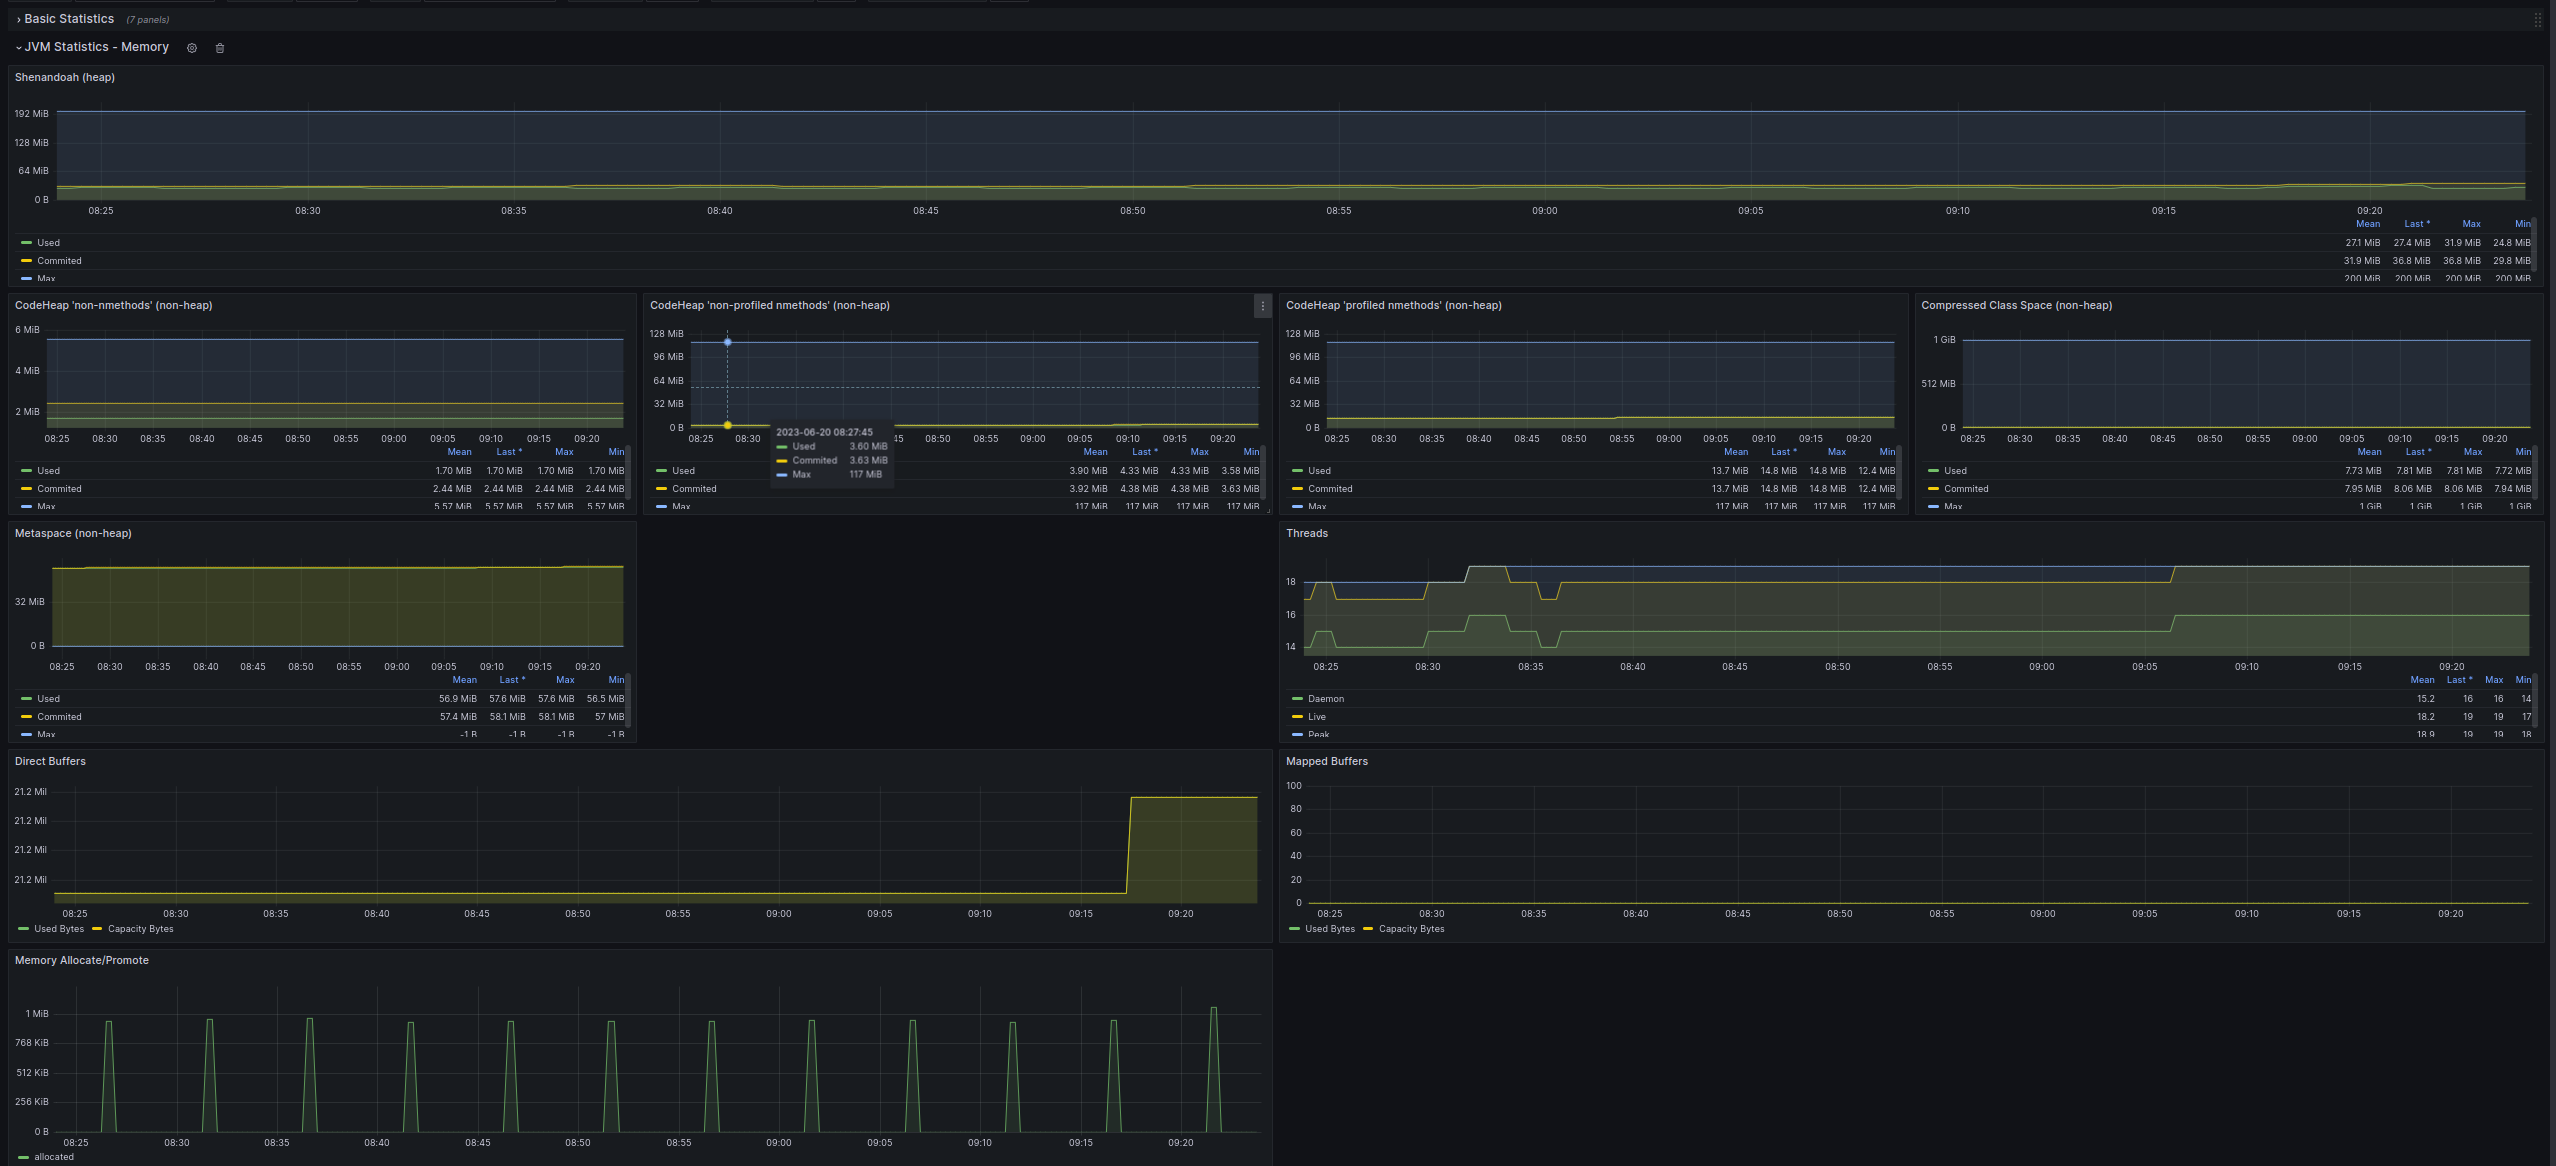
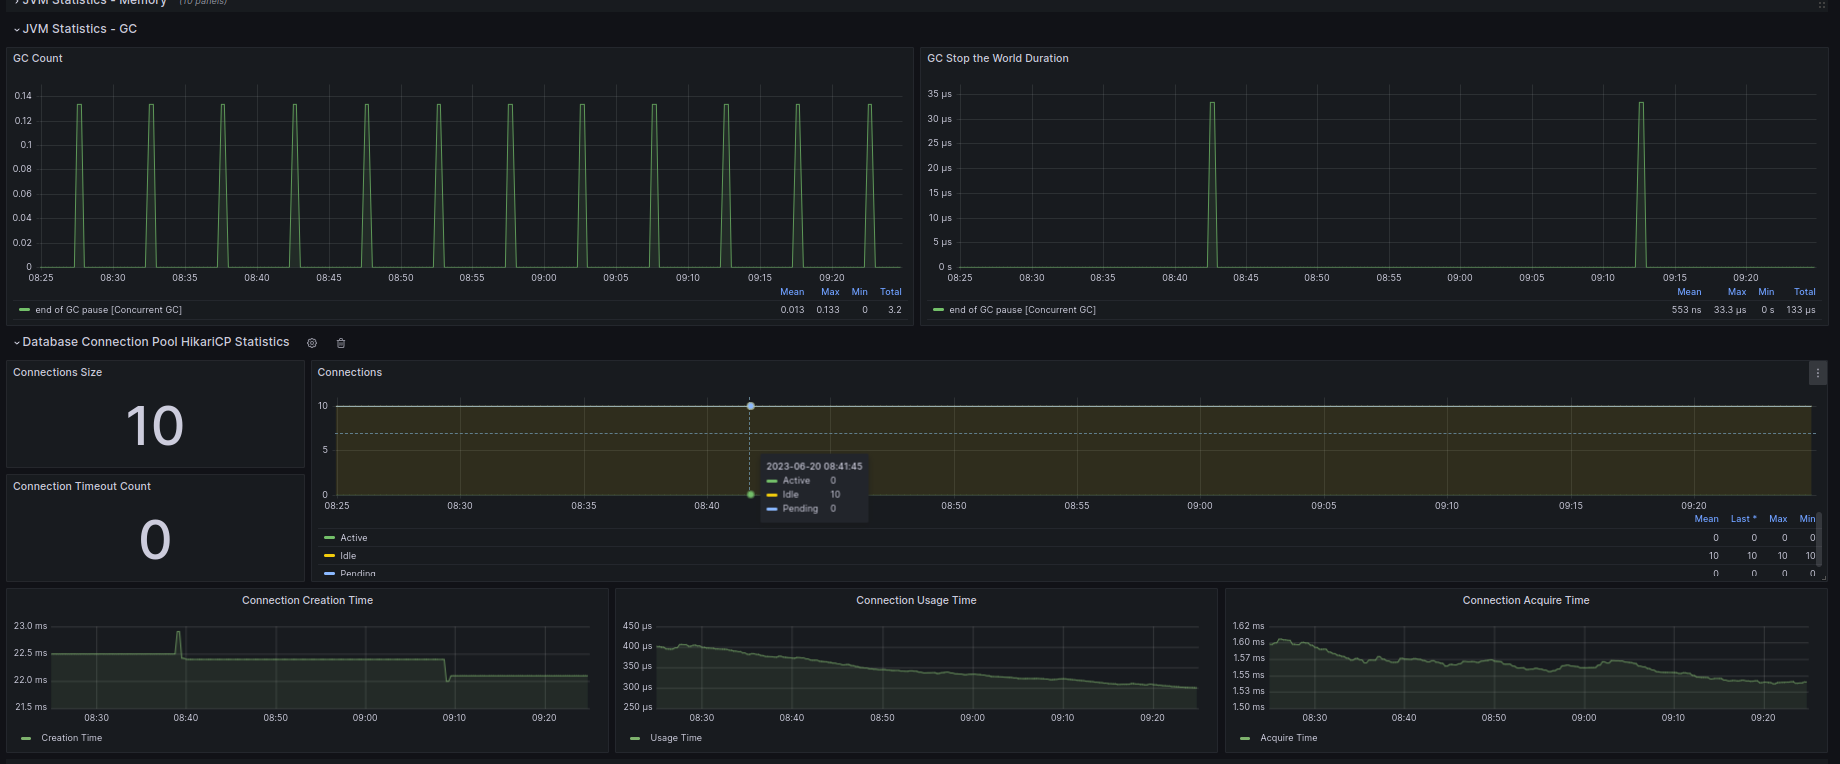
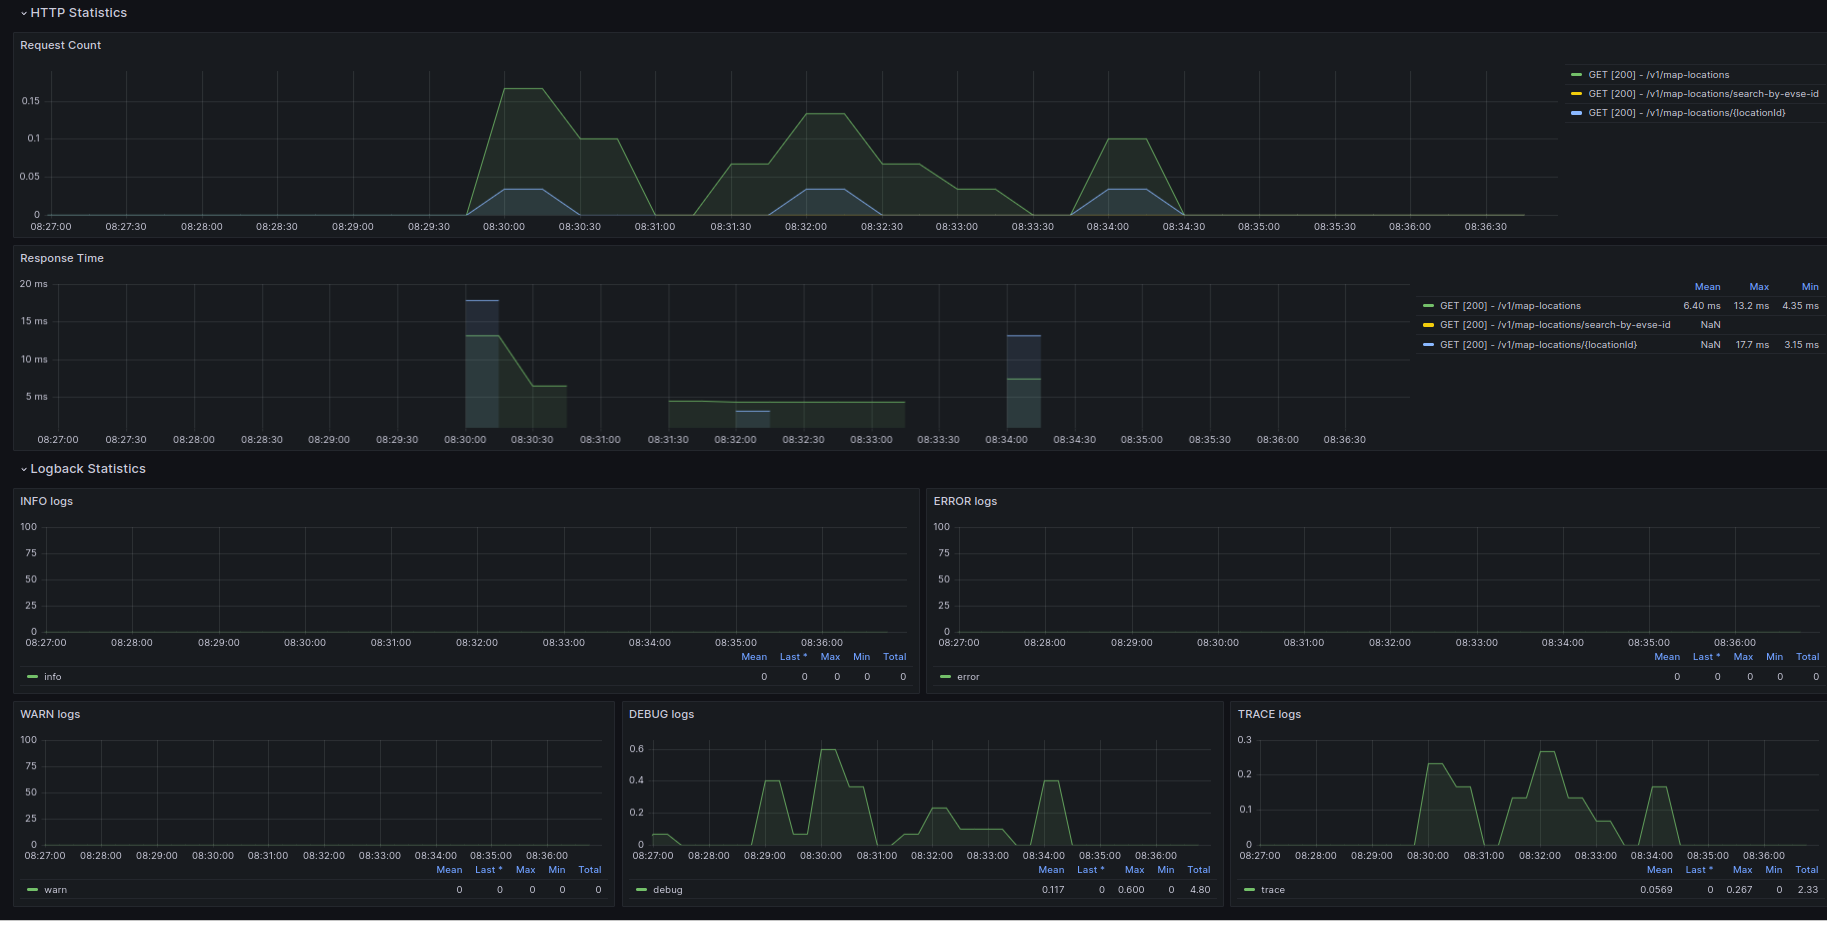
All rounded Spring Boot 3.x Grafana Dashboard suitable for Micrometer Prometheus metrics. https://micrometer.io/docs/registry/prometheus
Data source config
Collector type:
Collector plugins:
Collector config:
Revisions
Upload an updated version of an exported dashboard.json file from Grafana
| Revision | Description | Created | |
|---|---|---|---|
| Download |
Spring Boot
Easily monitor Spring Boot with Grafana Cloud's out-of-the-box monitoring solution.
Learn more