Concordium Node
Concordium node dashboard with Prometheus metrics
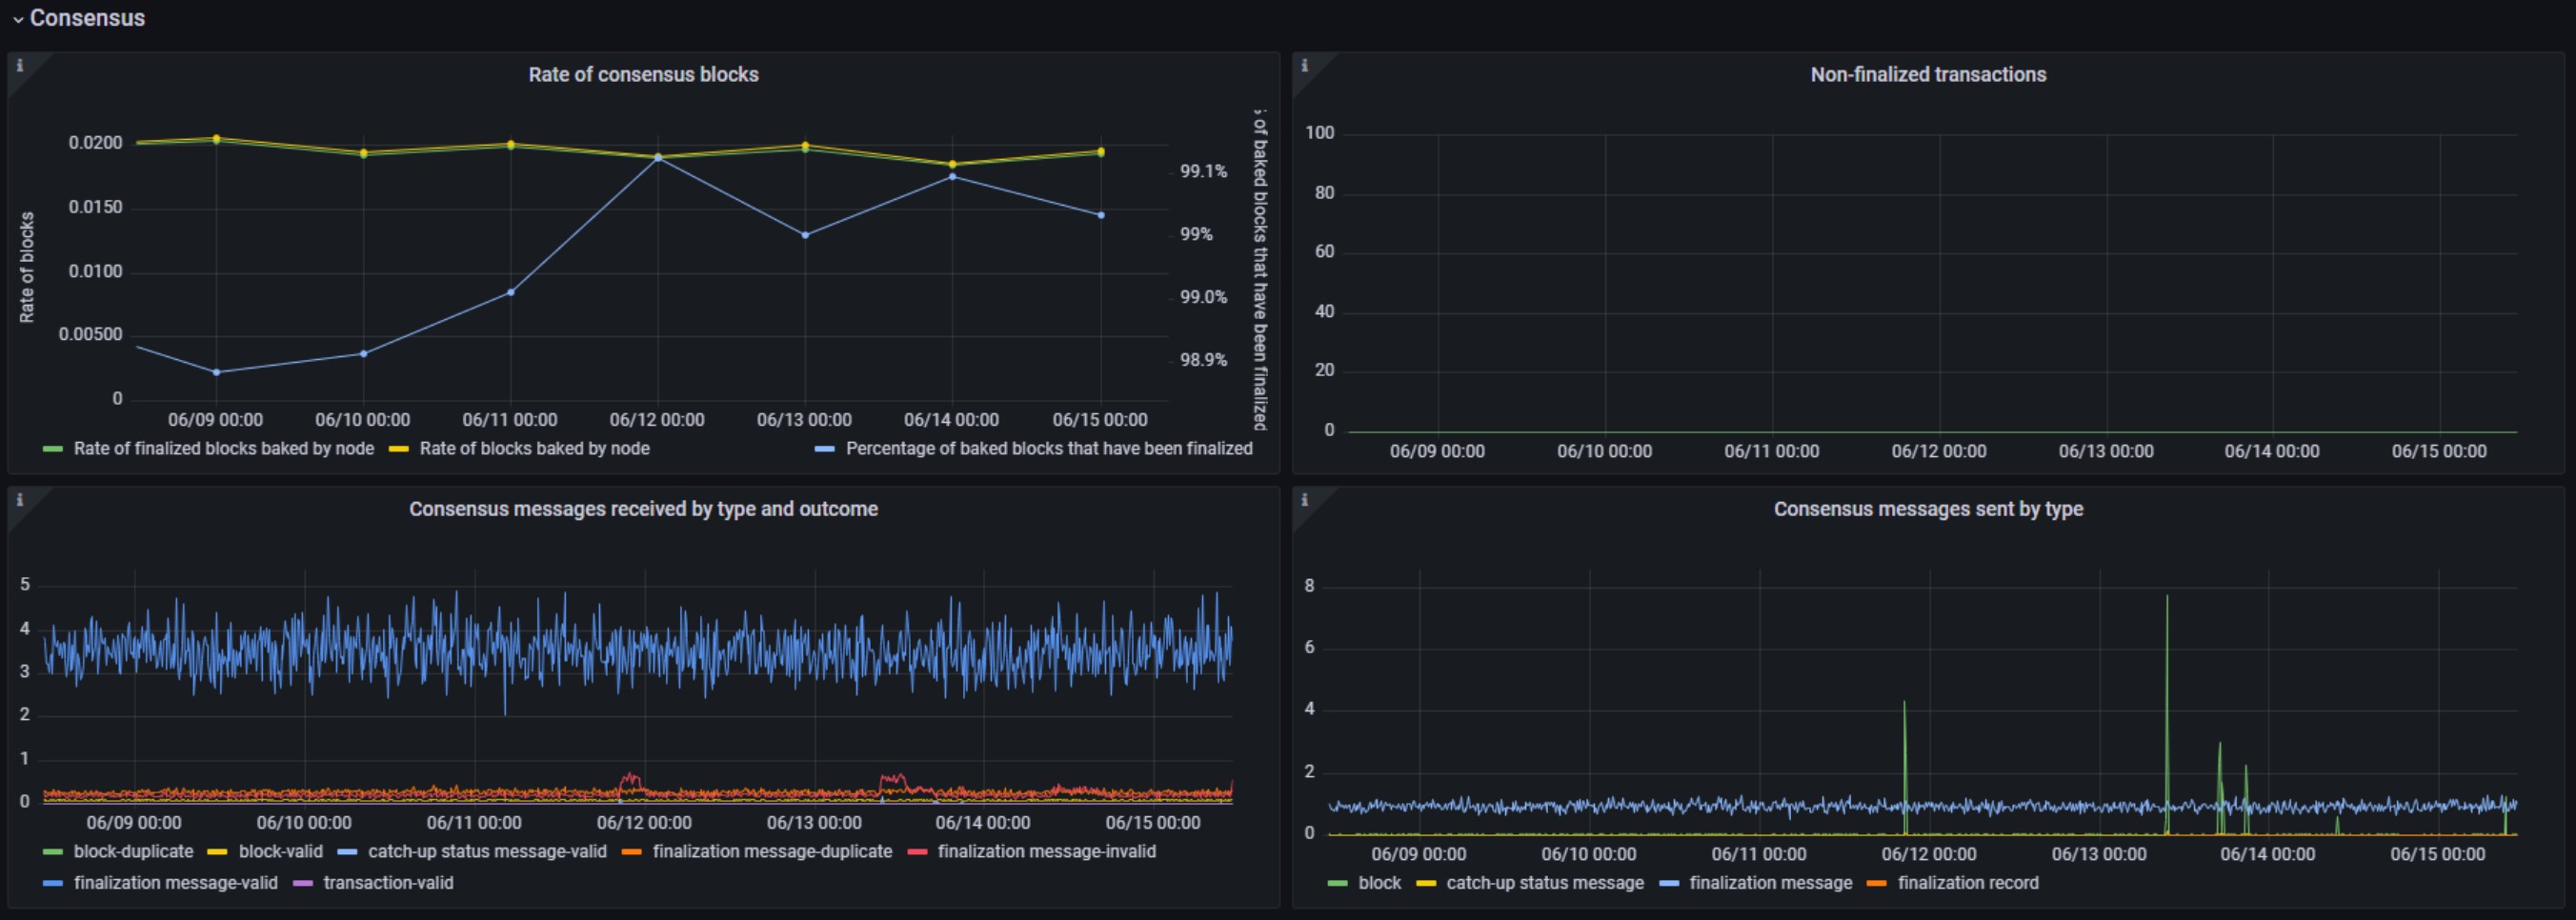
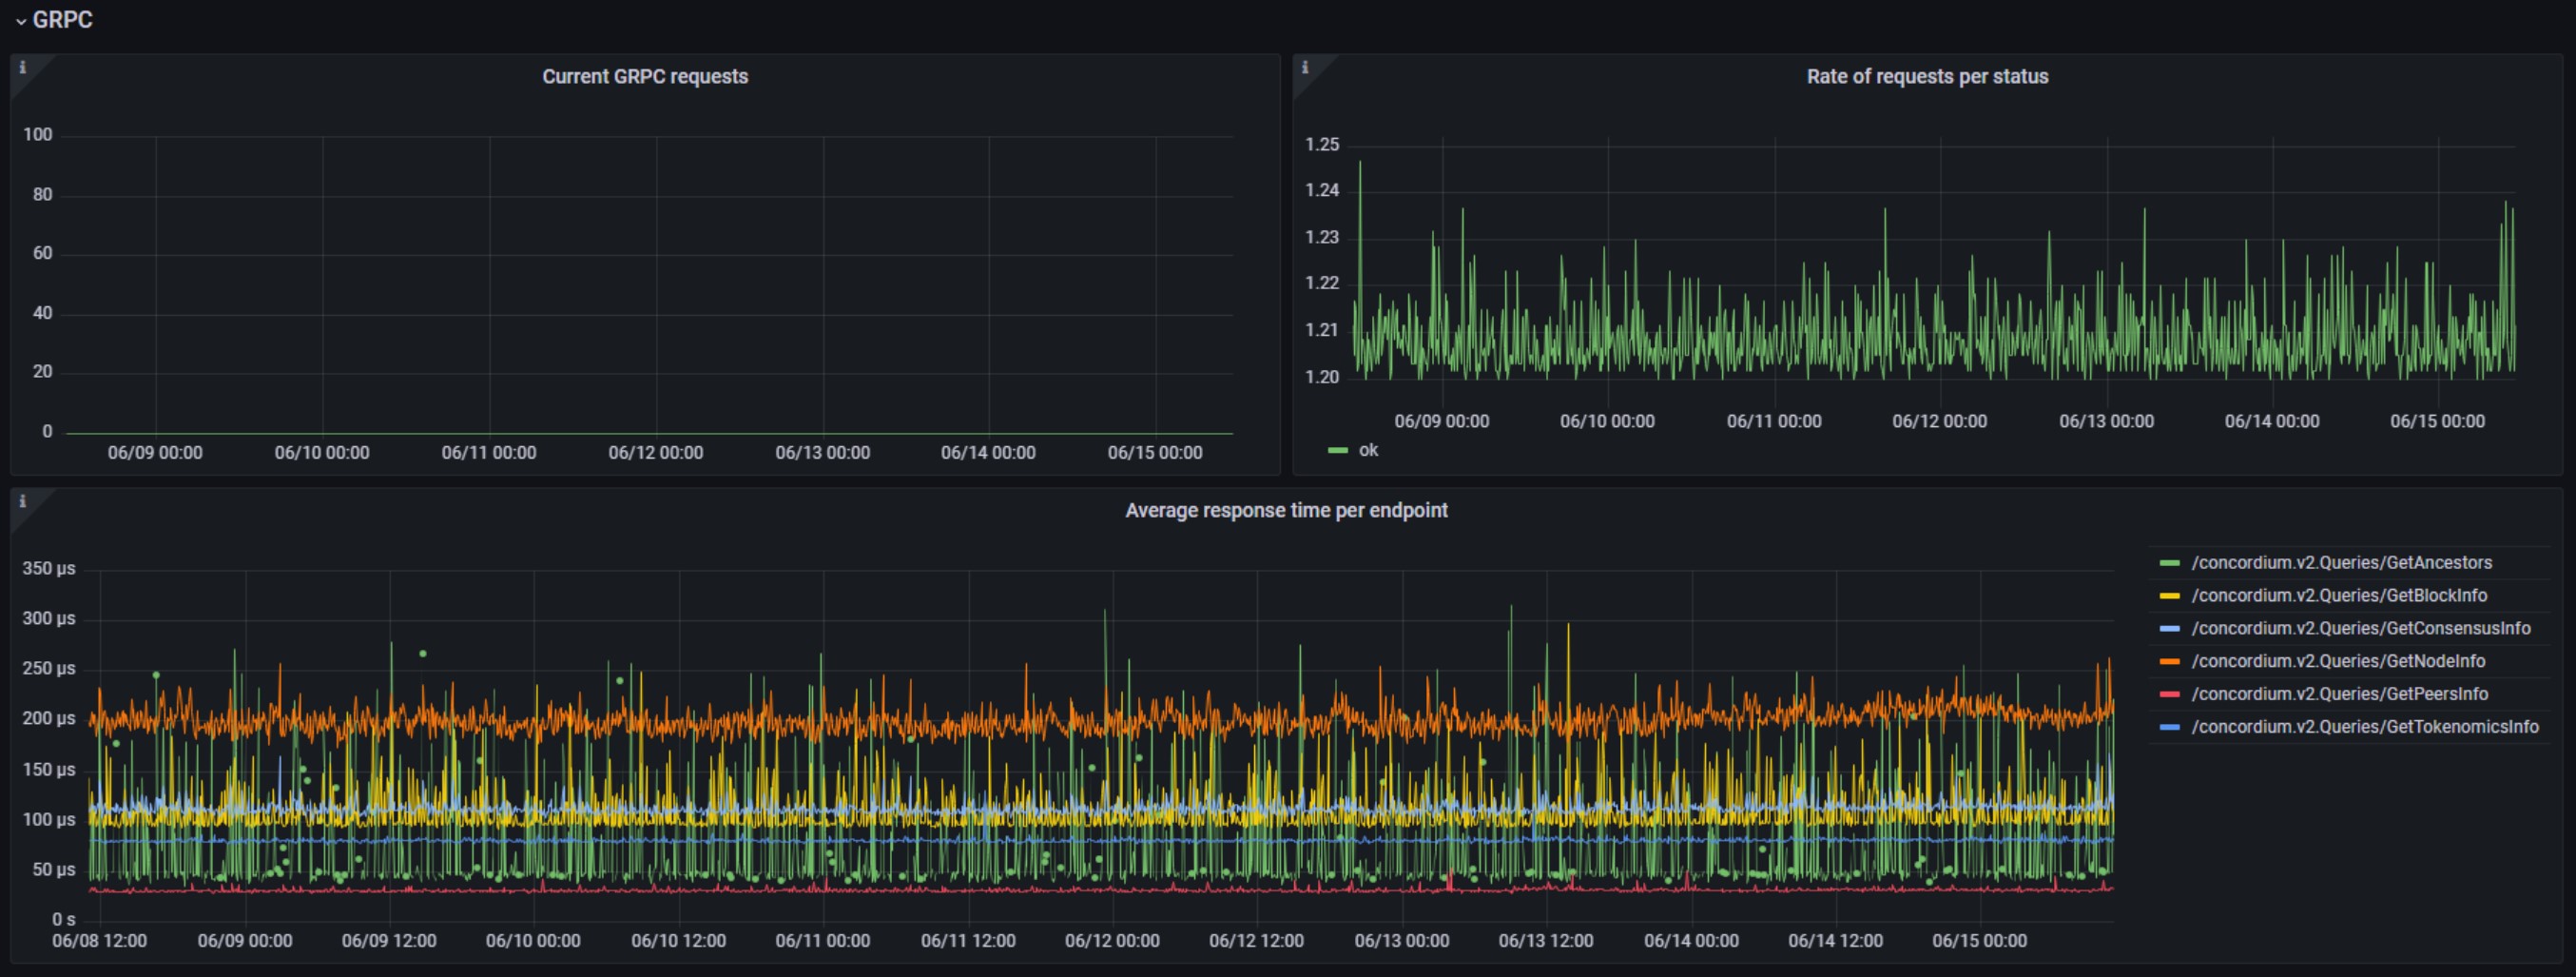
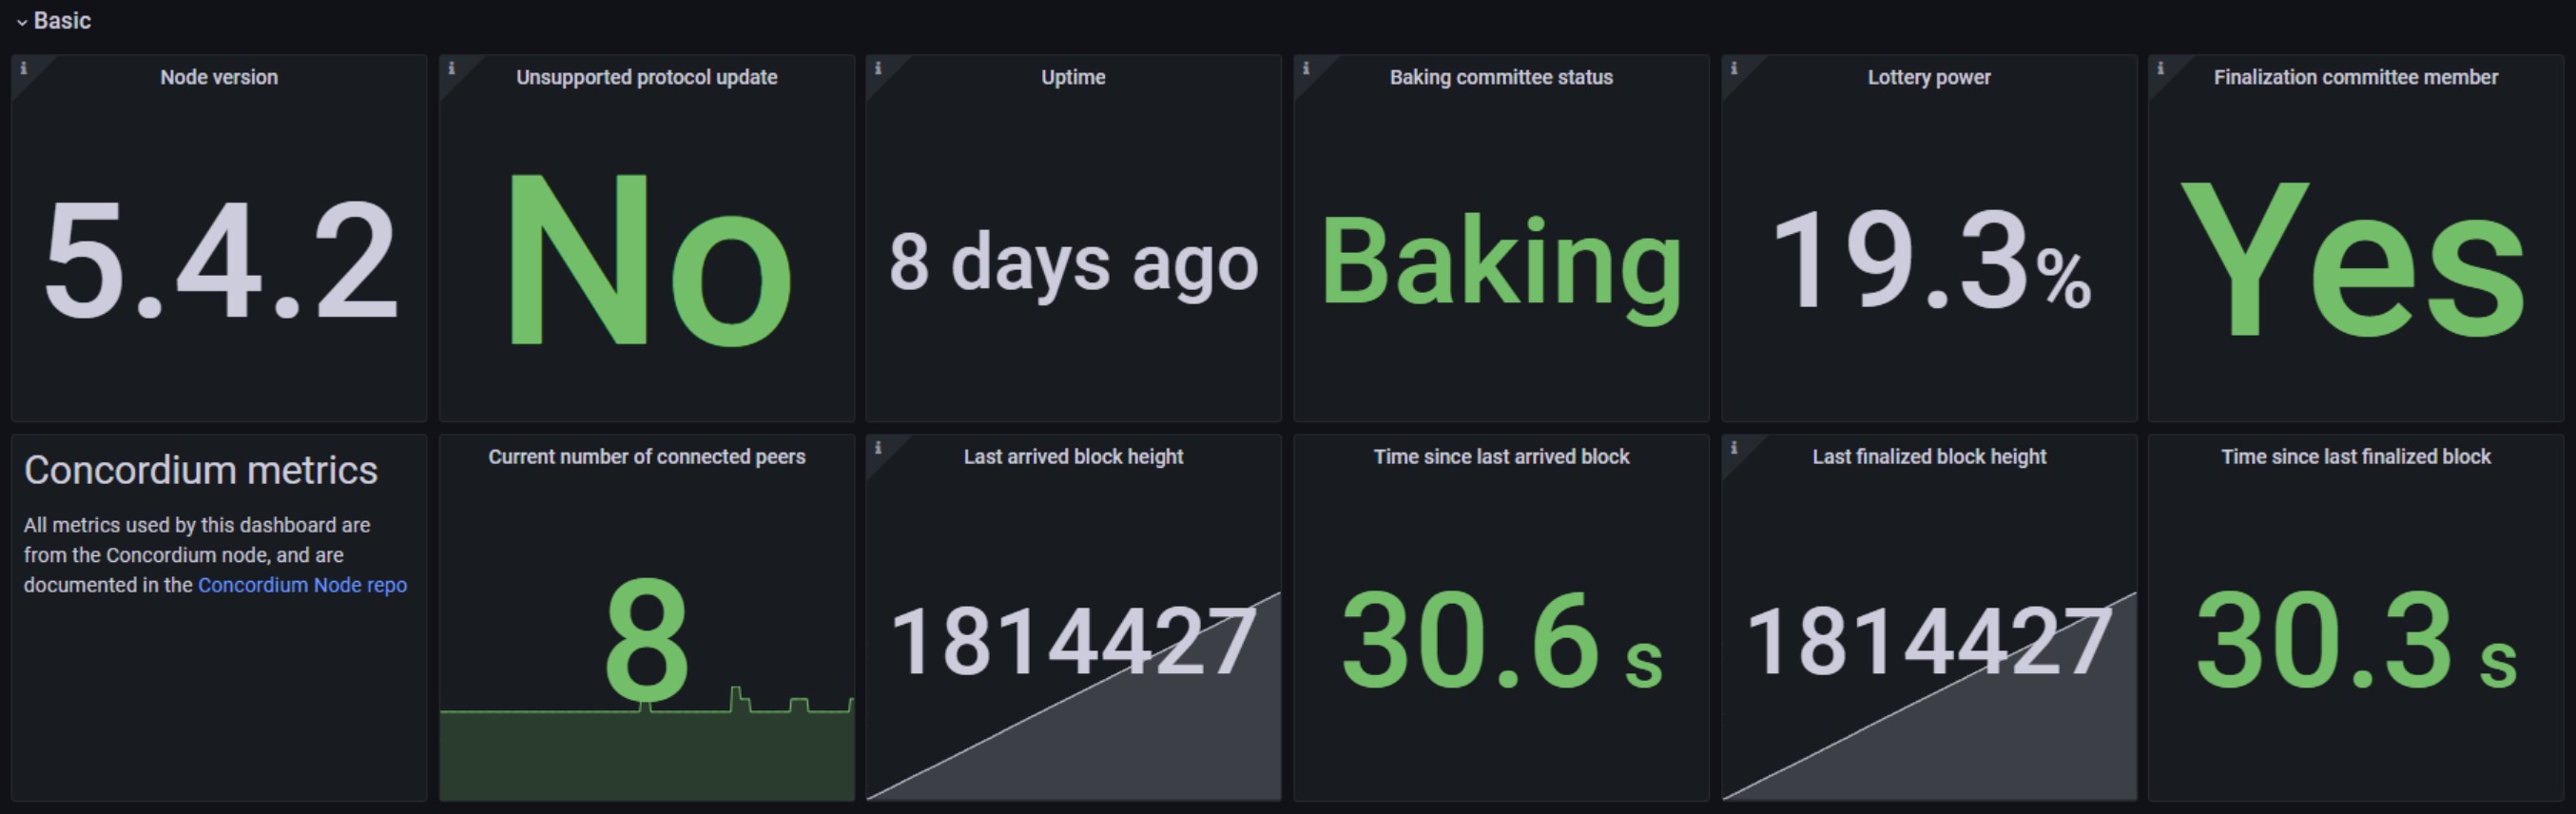
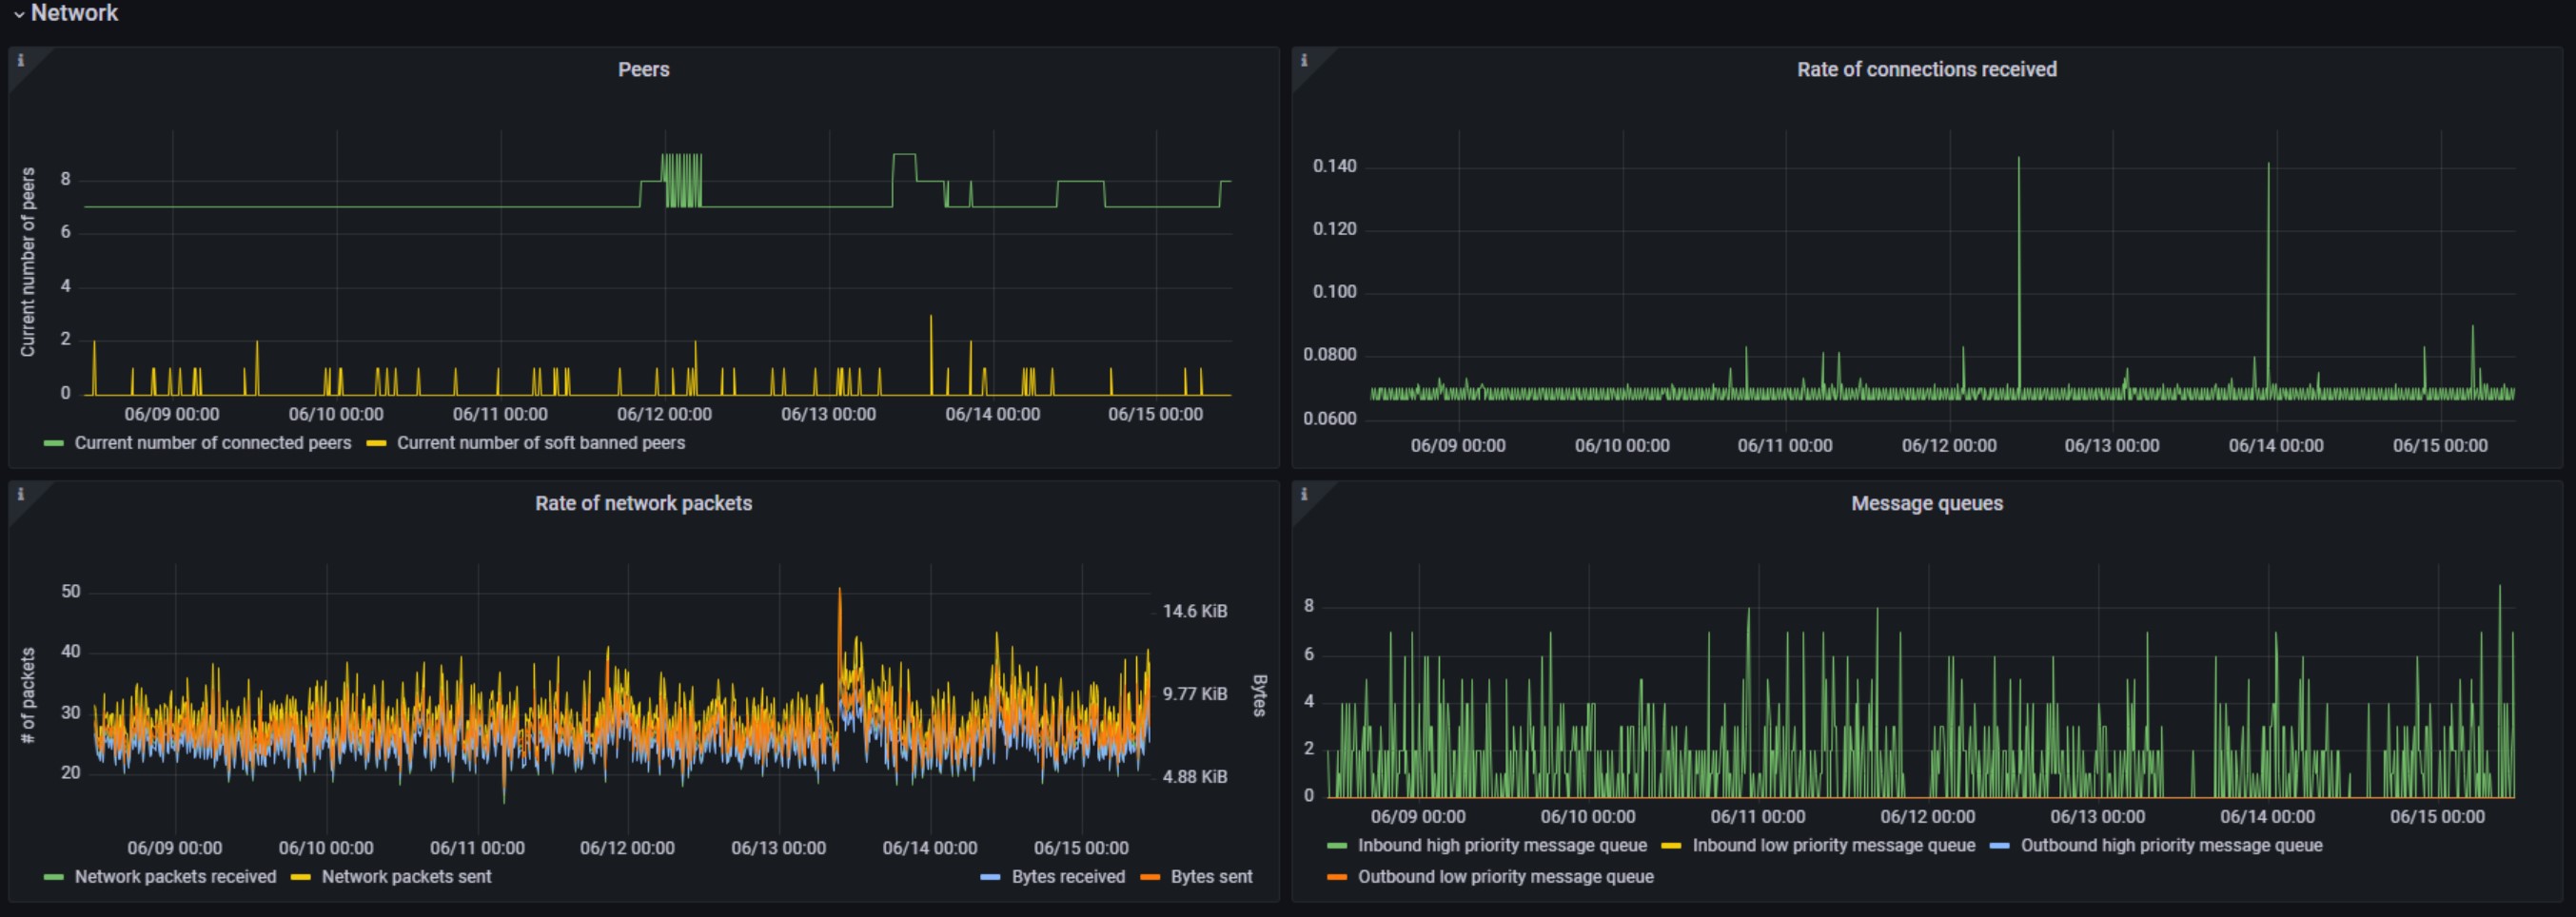
Dashboard showing most of the metrics available for the Concordium node.
For running a node please refer the official Concordium documentation.
How to enable Prometheus metrics in the Concordium node, and which metrics are available, is documented on Github.
Data source config
Collector type:
Collector plugins:
Collector config:
Revisions
Upload an updated version of an exported dashboard.json file from Grafana
| Revision | Description | Created | |
|---|---|---|---|
| Download |
Linux Server
Monitor Linux with Grafana. Easily monitor your Linux deployment with Grafana Cloud's out-of-the-box monitoring solution.
Learn more