System dashboard v0.4.0
display all machines base information to one dashboard, include cpu/ memory / network io / disk info
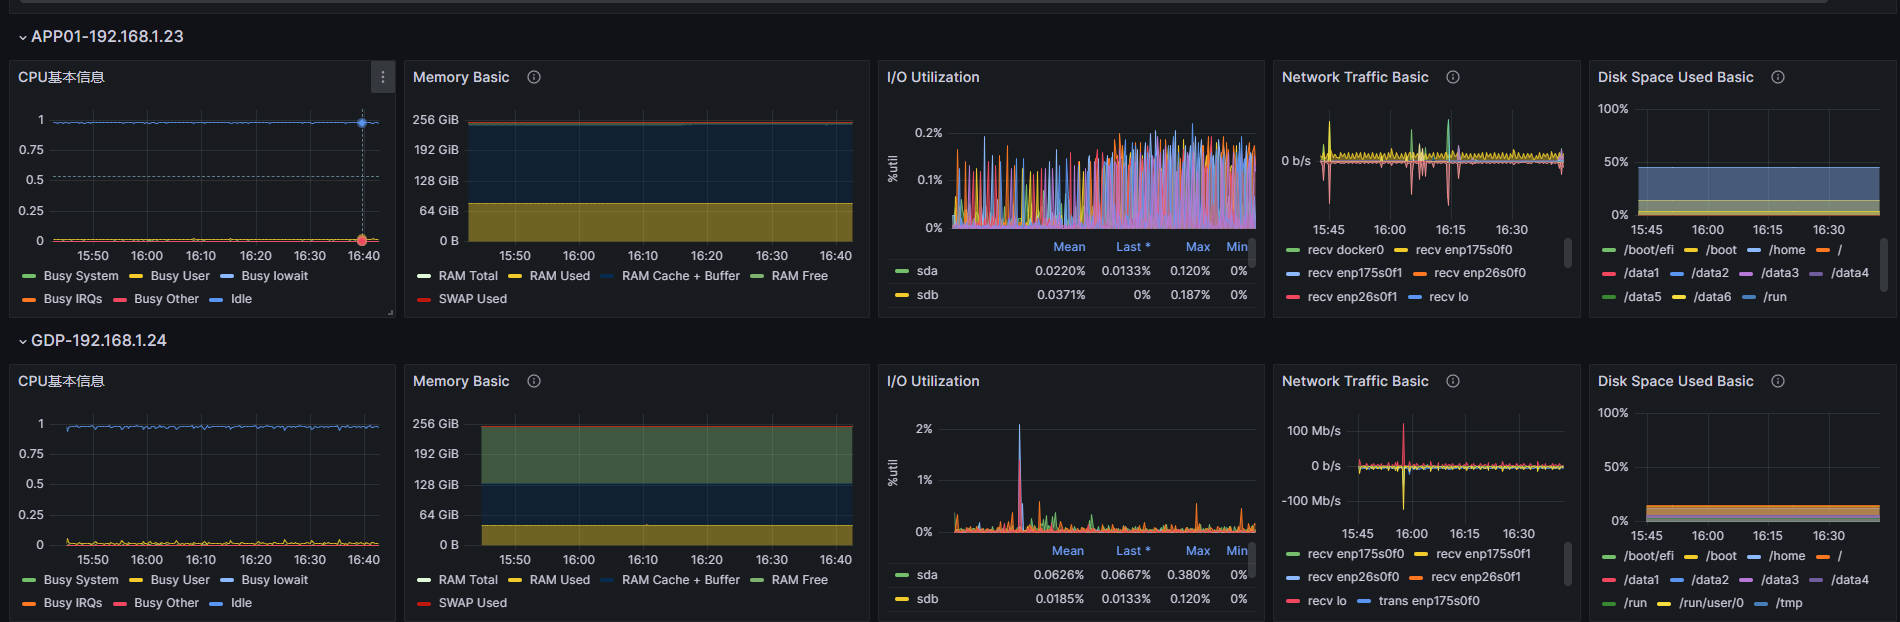
The System dashboard v0.4.0 dashboard uses the prometheus data source to create a Grafana dashboard with the gauge, stat and timeseries panels.
Data source config
Collector type:
Collector plugins:
Collector config:
Revisions
Upload an updated version of an exported dashboard.json file from Grafana
| Revision | Description | Created | |
|---|---|---|---|
| Download |