Camel Kafka
Simple dashboard to read metrics from actuator and camel kafka
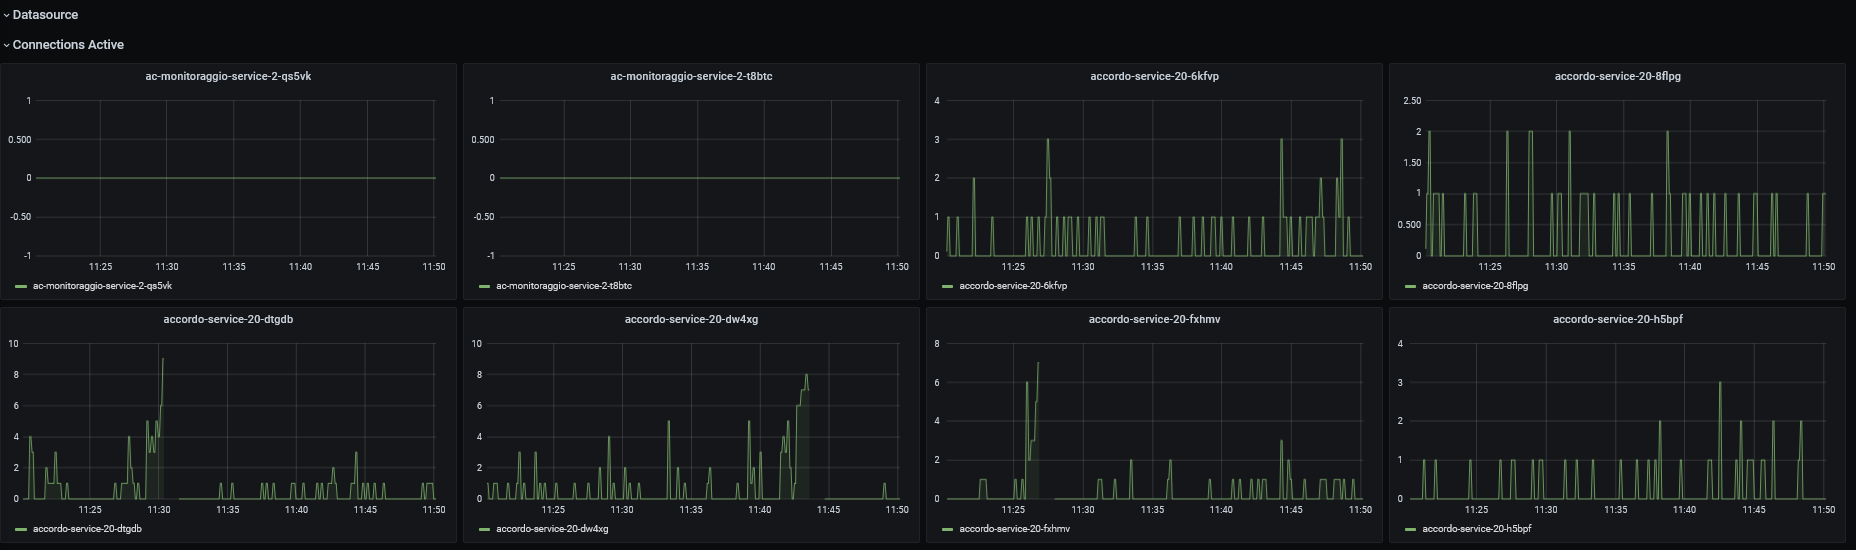
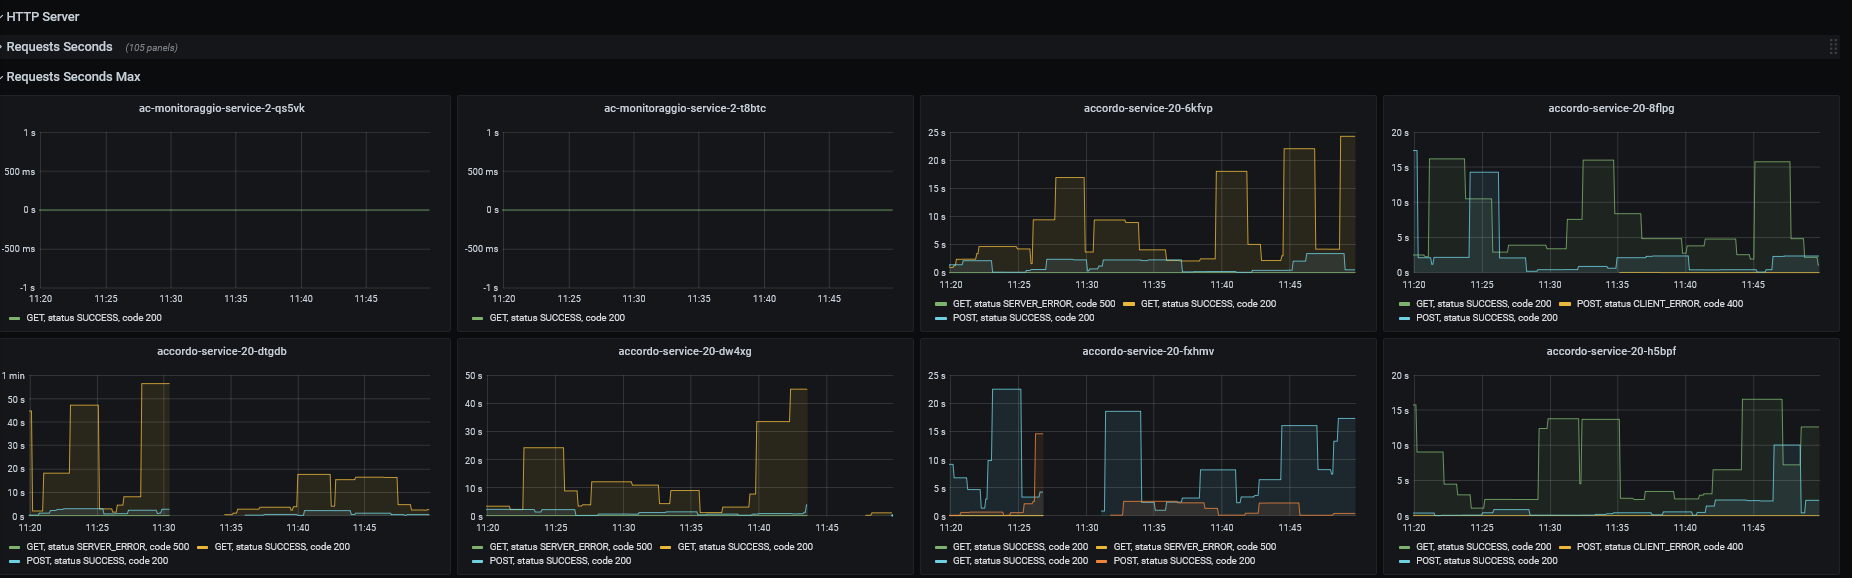
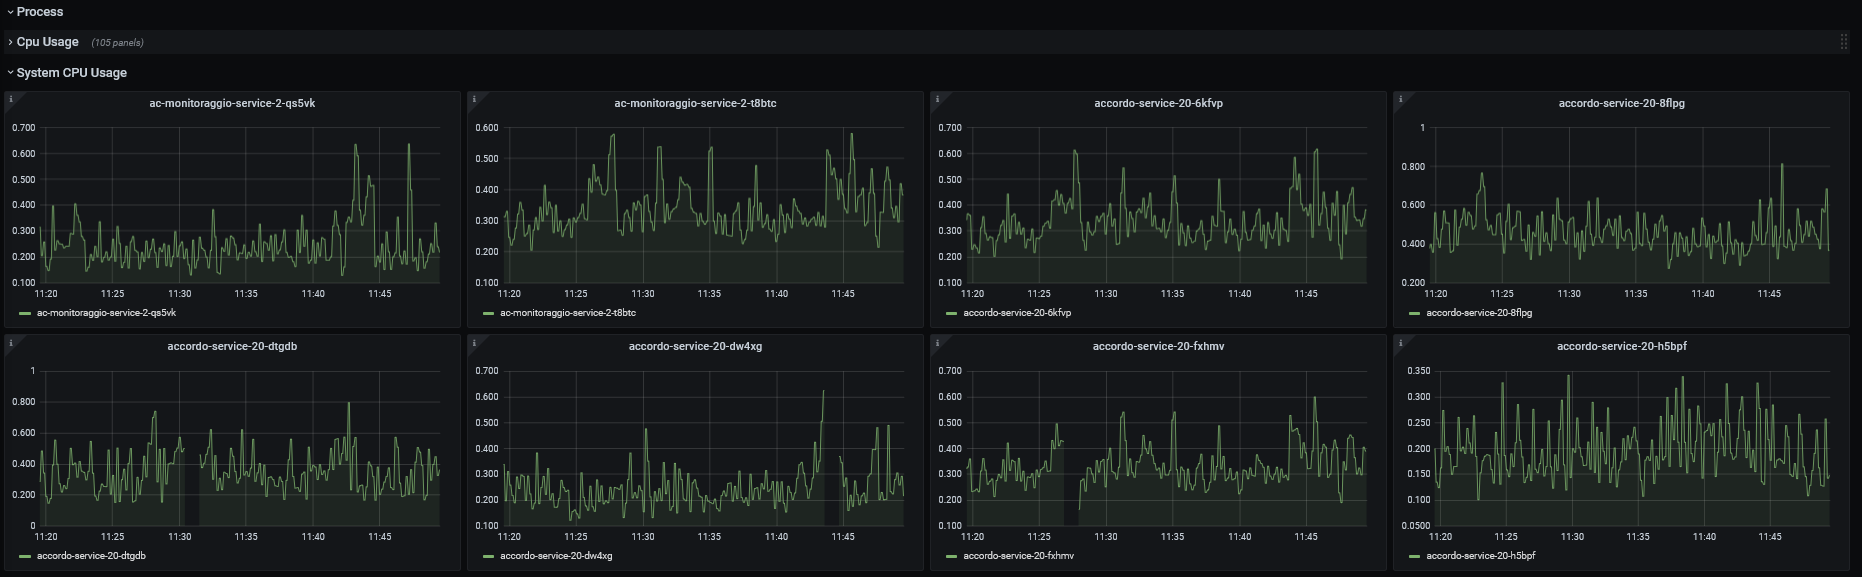
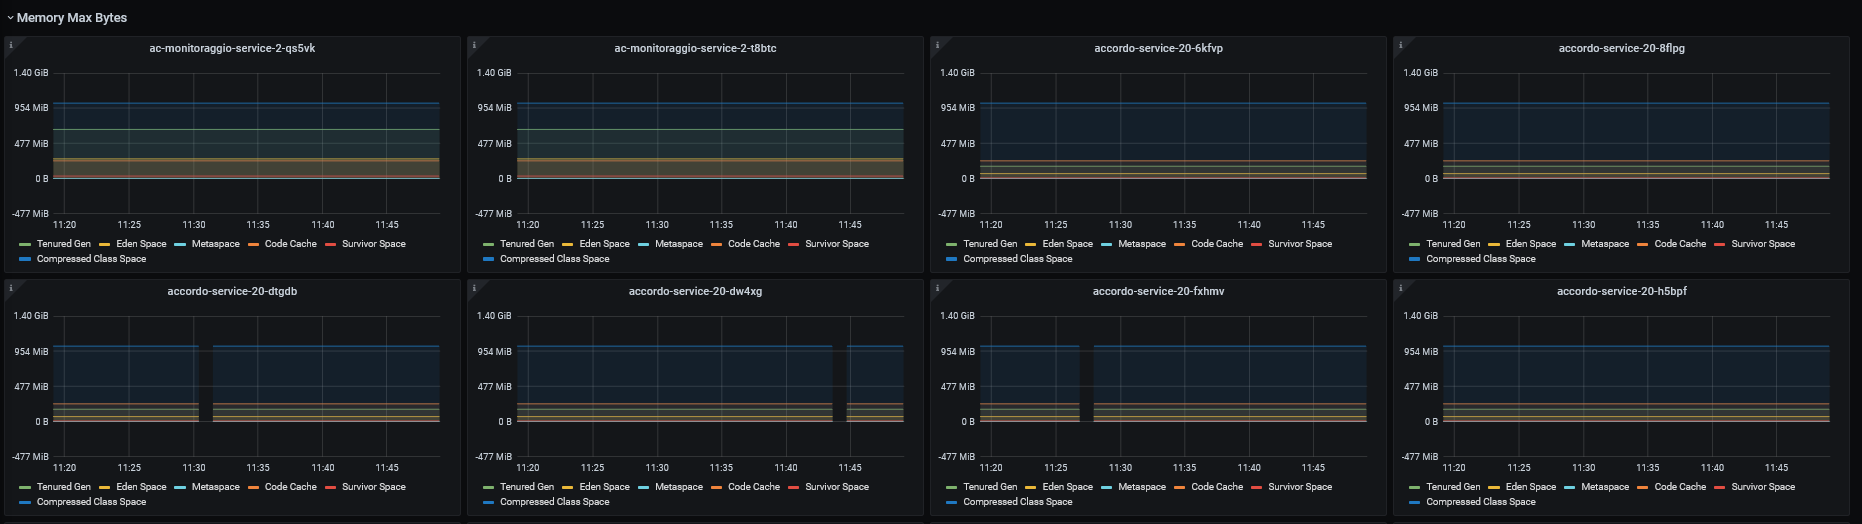
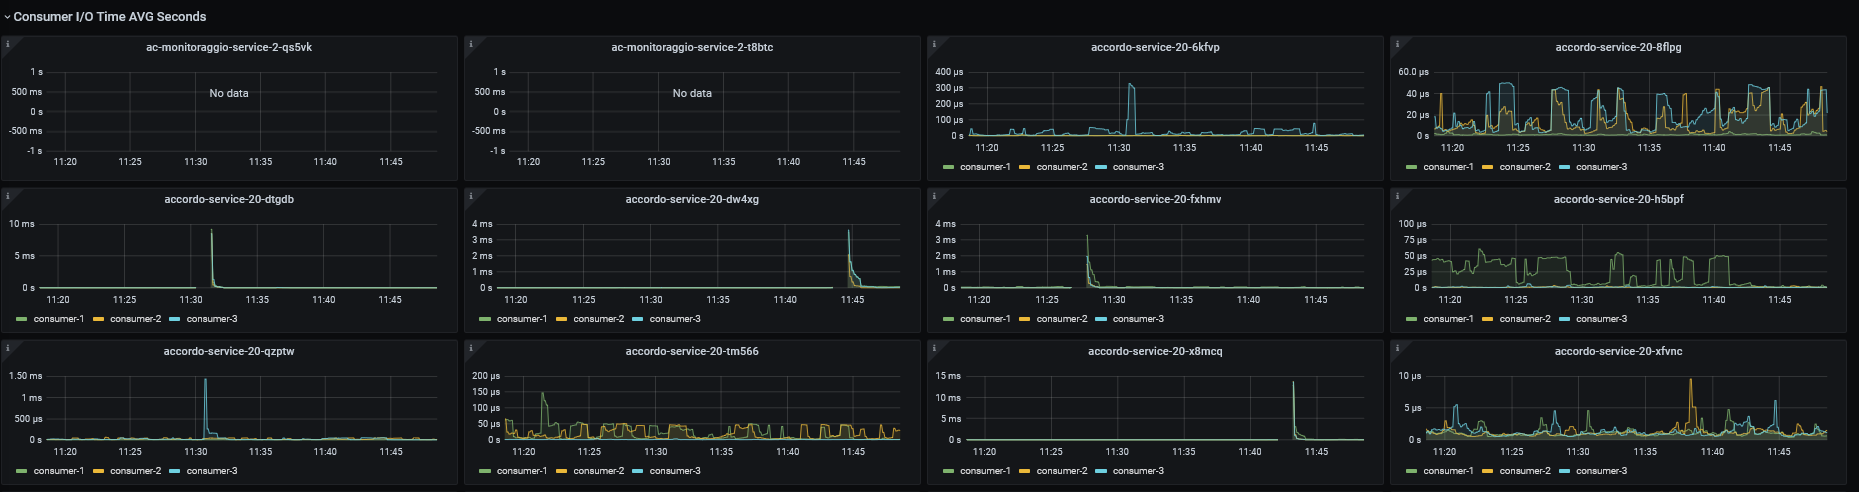
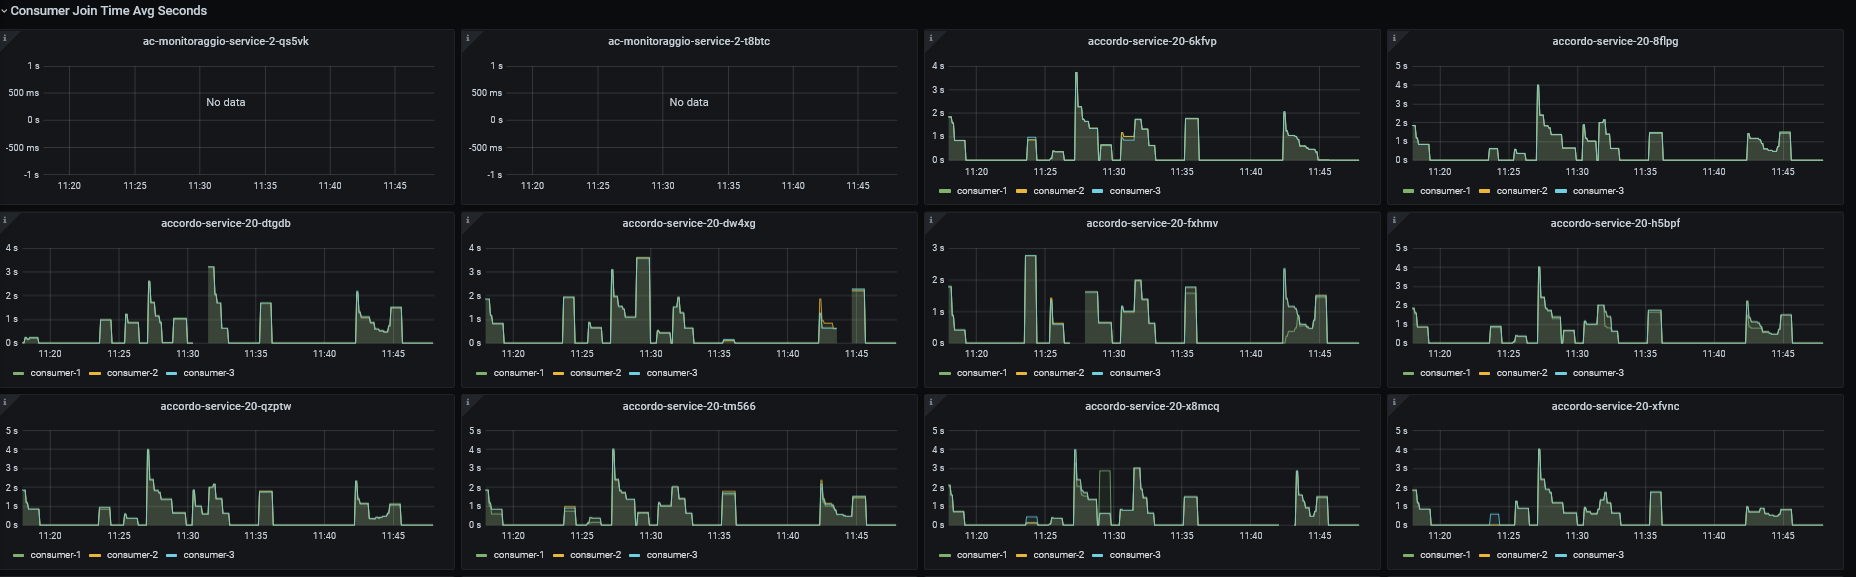
The Camel Kafka dashboard uses the prometheus data source to create a Grafana dashboard with the gauge, graph and stat panels.
Data source config
Collector type:
Collector plugins:
Collector config:
Revisions
Upload an updated version of an exported dashboard.json file from Grafana
| Revision | Description | Created | |
|---|---|---|---|
| Download |
Kafka
Easily monitor your Kafka deployment with Grafana Cloud's out-of-the-box monitoring solution.
Learn more