Syslog
Syslog receiver using Telegraf, InfluxDB 2.x & Grafana
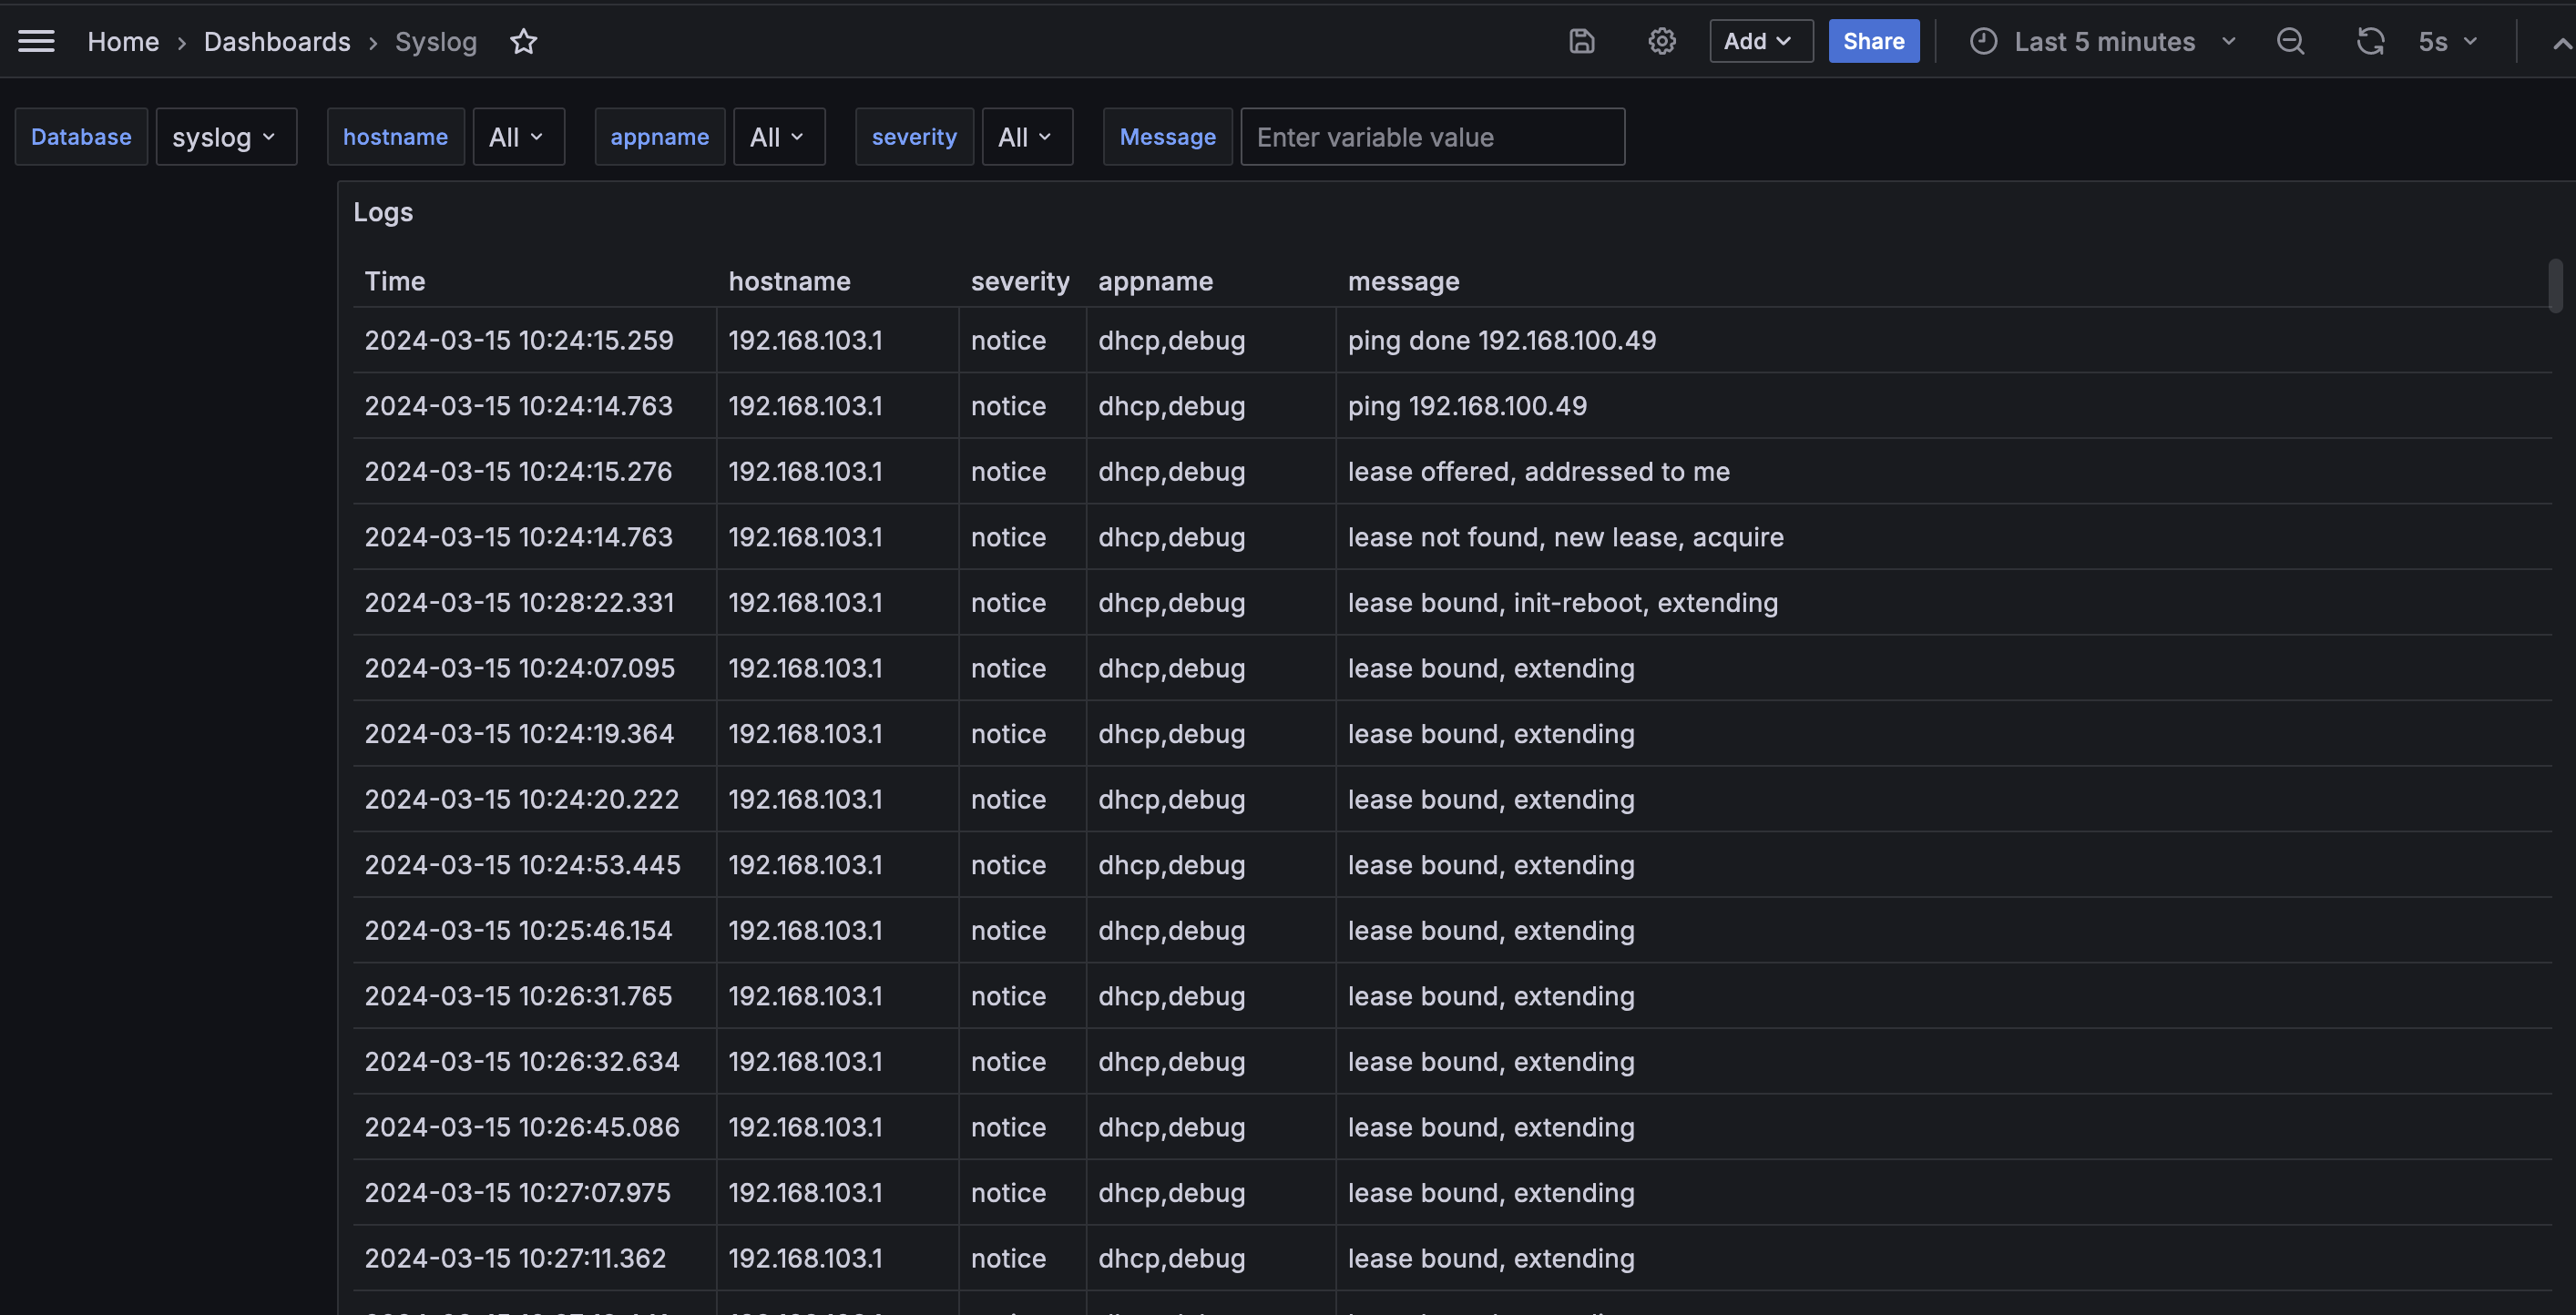
Features:
- Search String
- Filter by app
- Filter by host
- Filter by Database/bucket
For Docker setup:
https://github.com/AAm-kun/Grafana-Influxdb_2.x-Syslog-server
Workflow:
Network/Compute Devices Syslog -> syslog-ng (UDP port 514) -> telegraf (tcp port 6514) -> influxdb2.x (tcp port 8086) <- Grafana (port 3000)
Data source config
Collector type:
Collector plugins:
Collector config:
Revisions
Upload an updated version of an exported dashboard.json file from Grafana
| Revision | Description | Created | |
|---|---|---|---|
| Download |