AWS OpenSearch
Let's you visualise cluster health, latency, indexing rate, free storage and more.
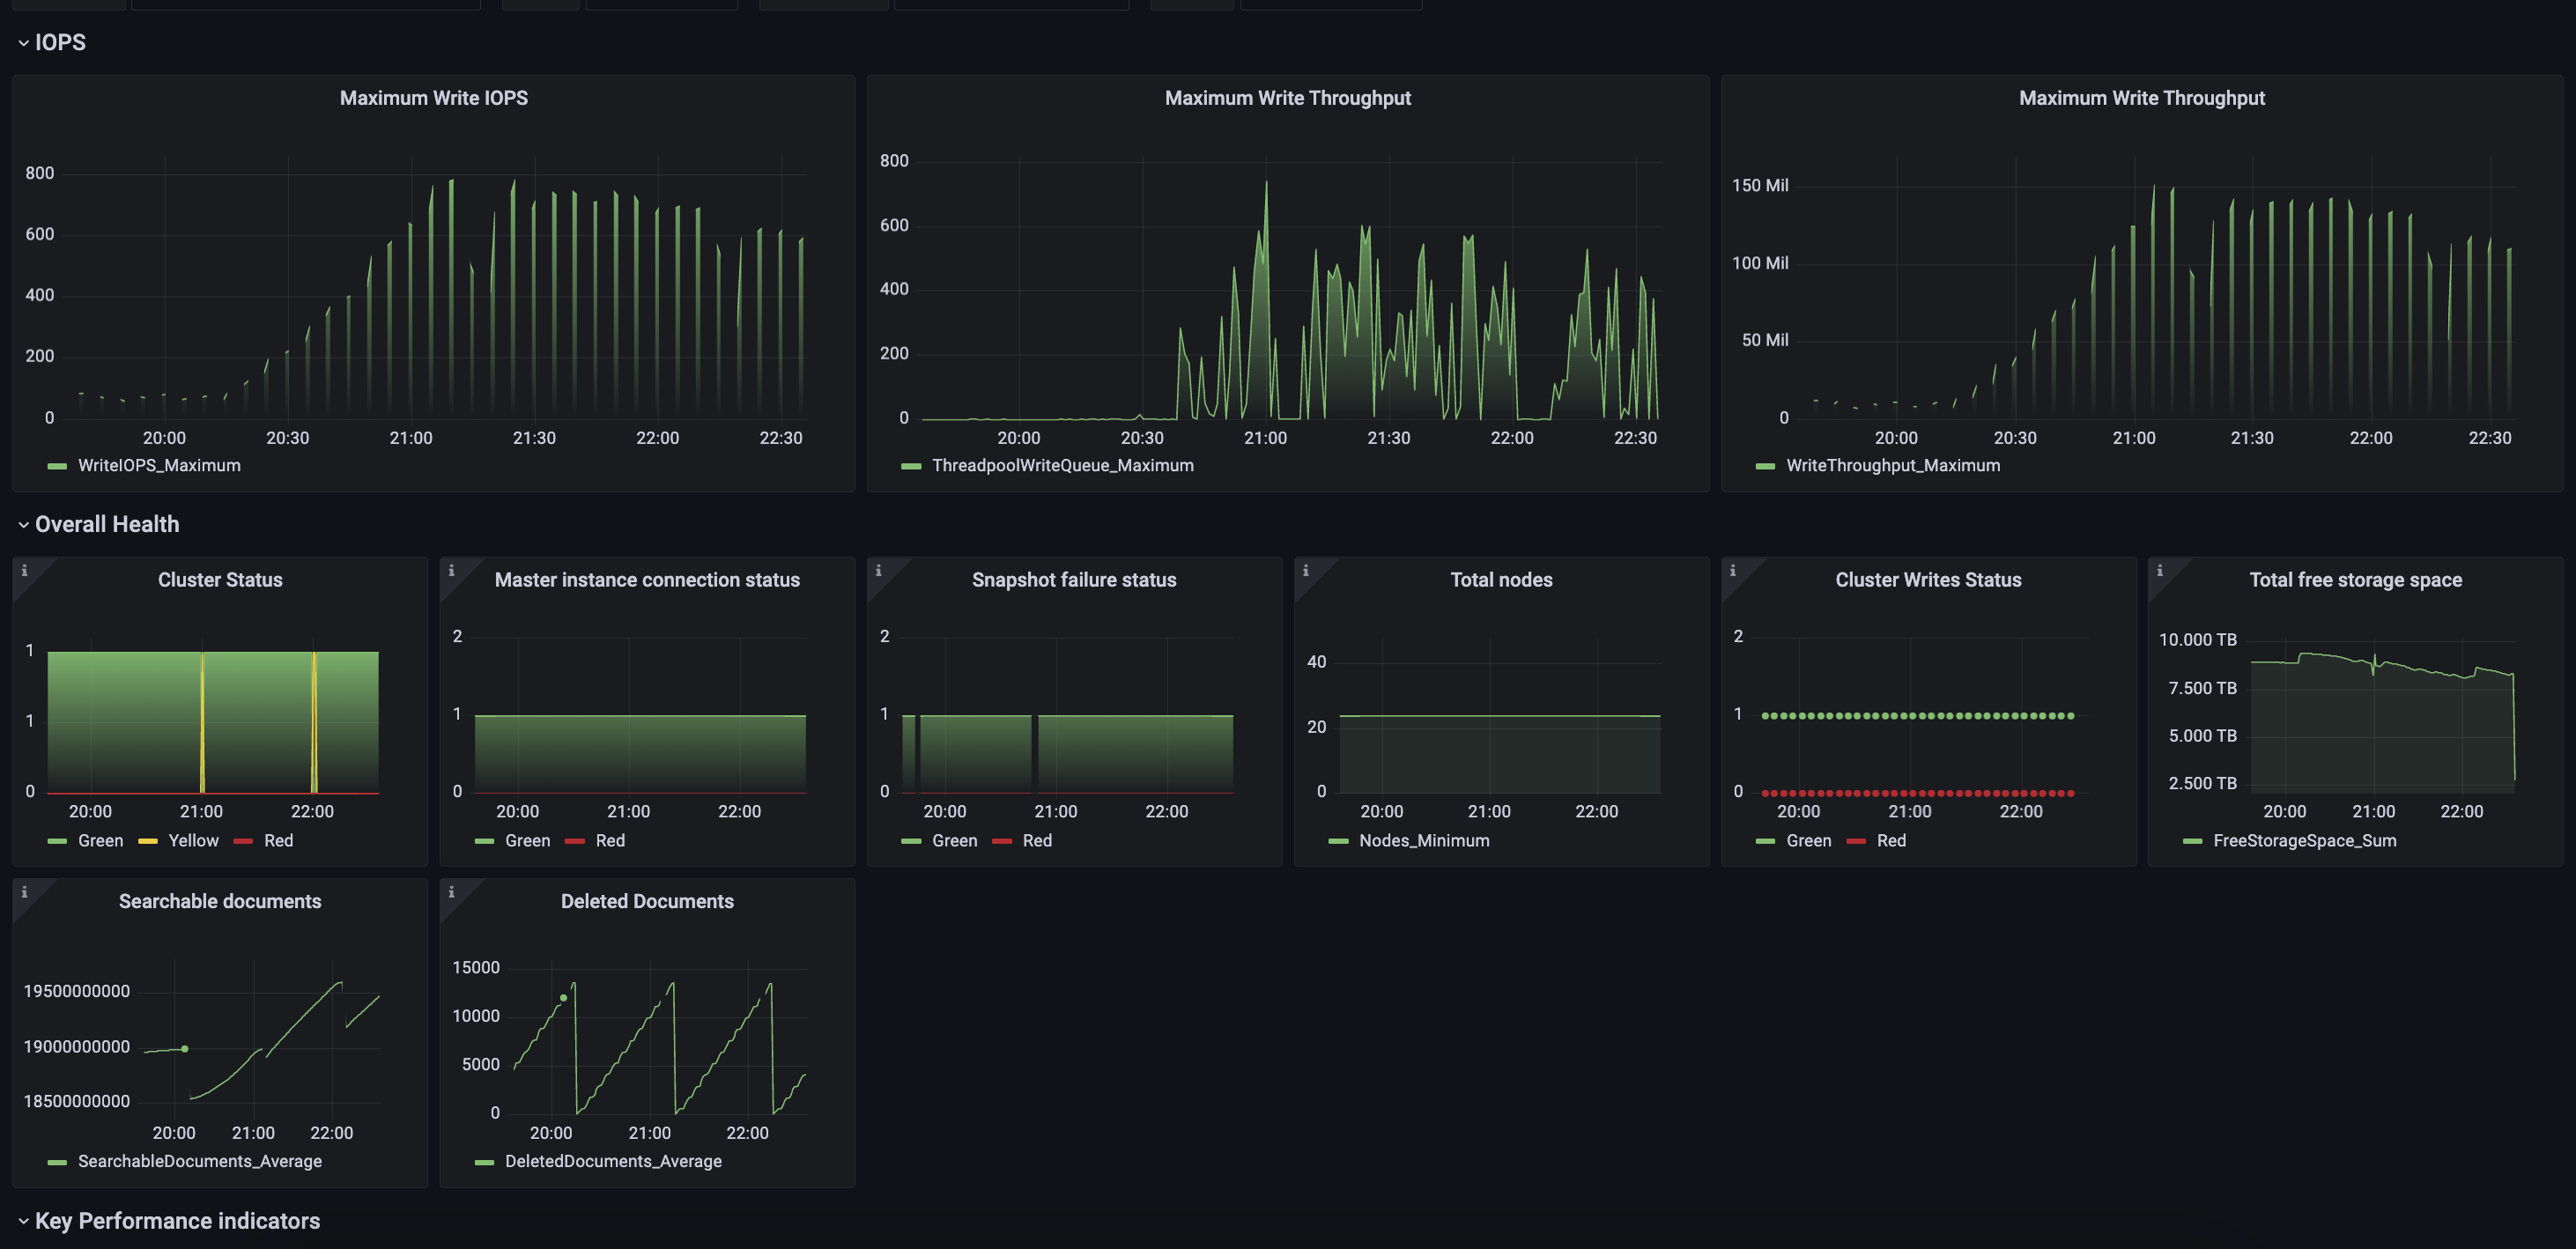
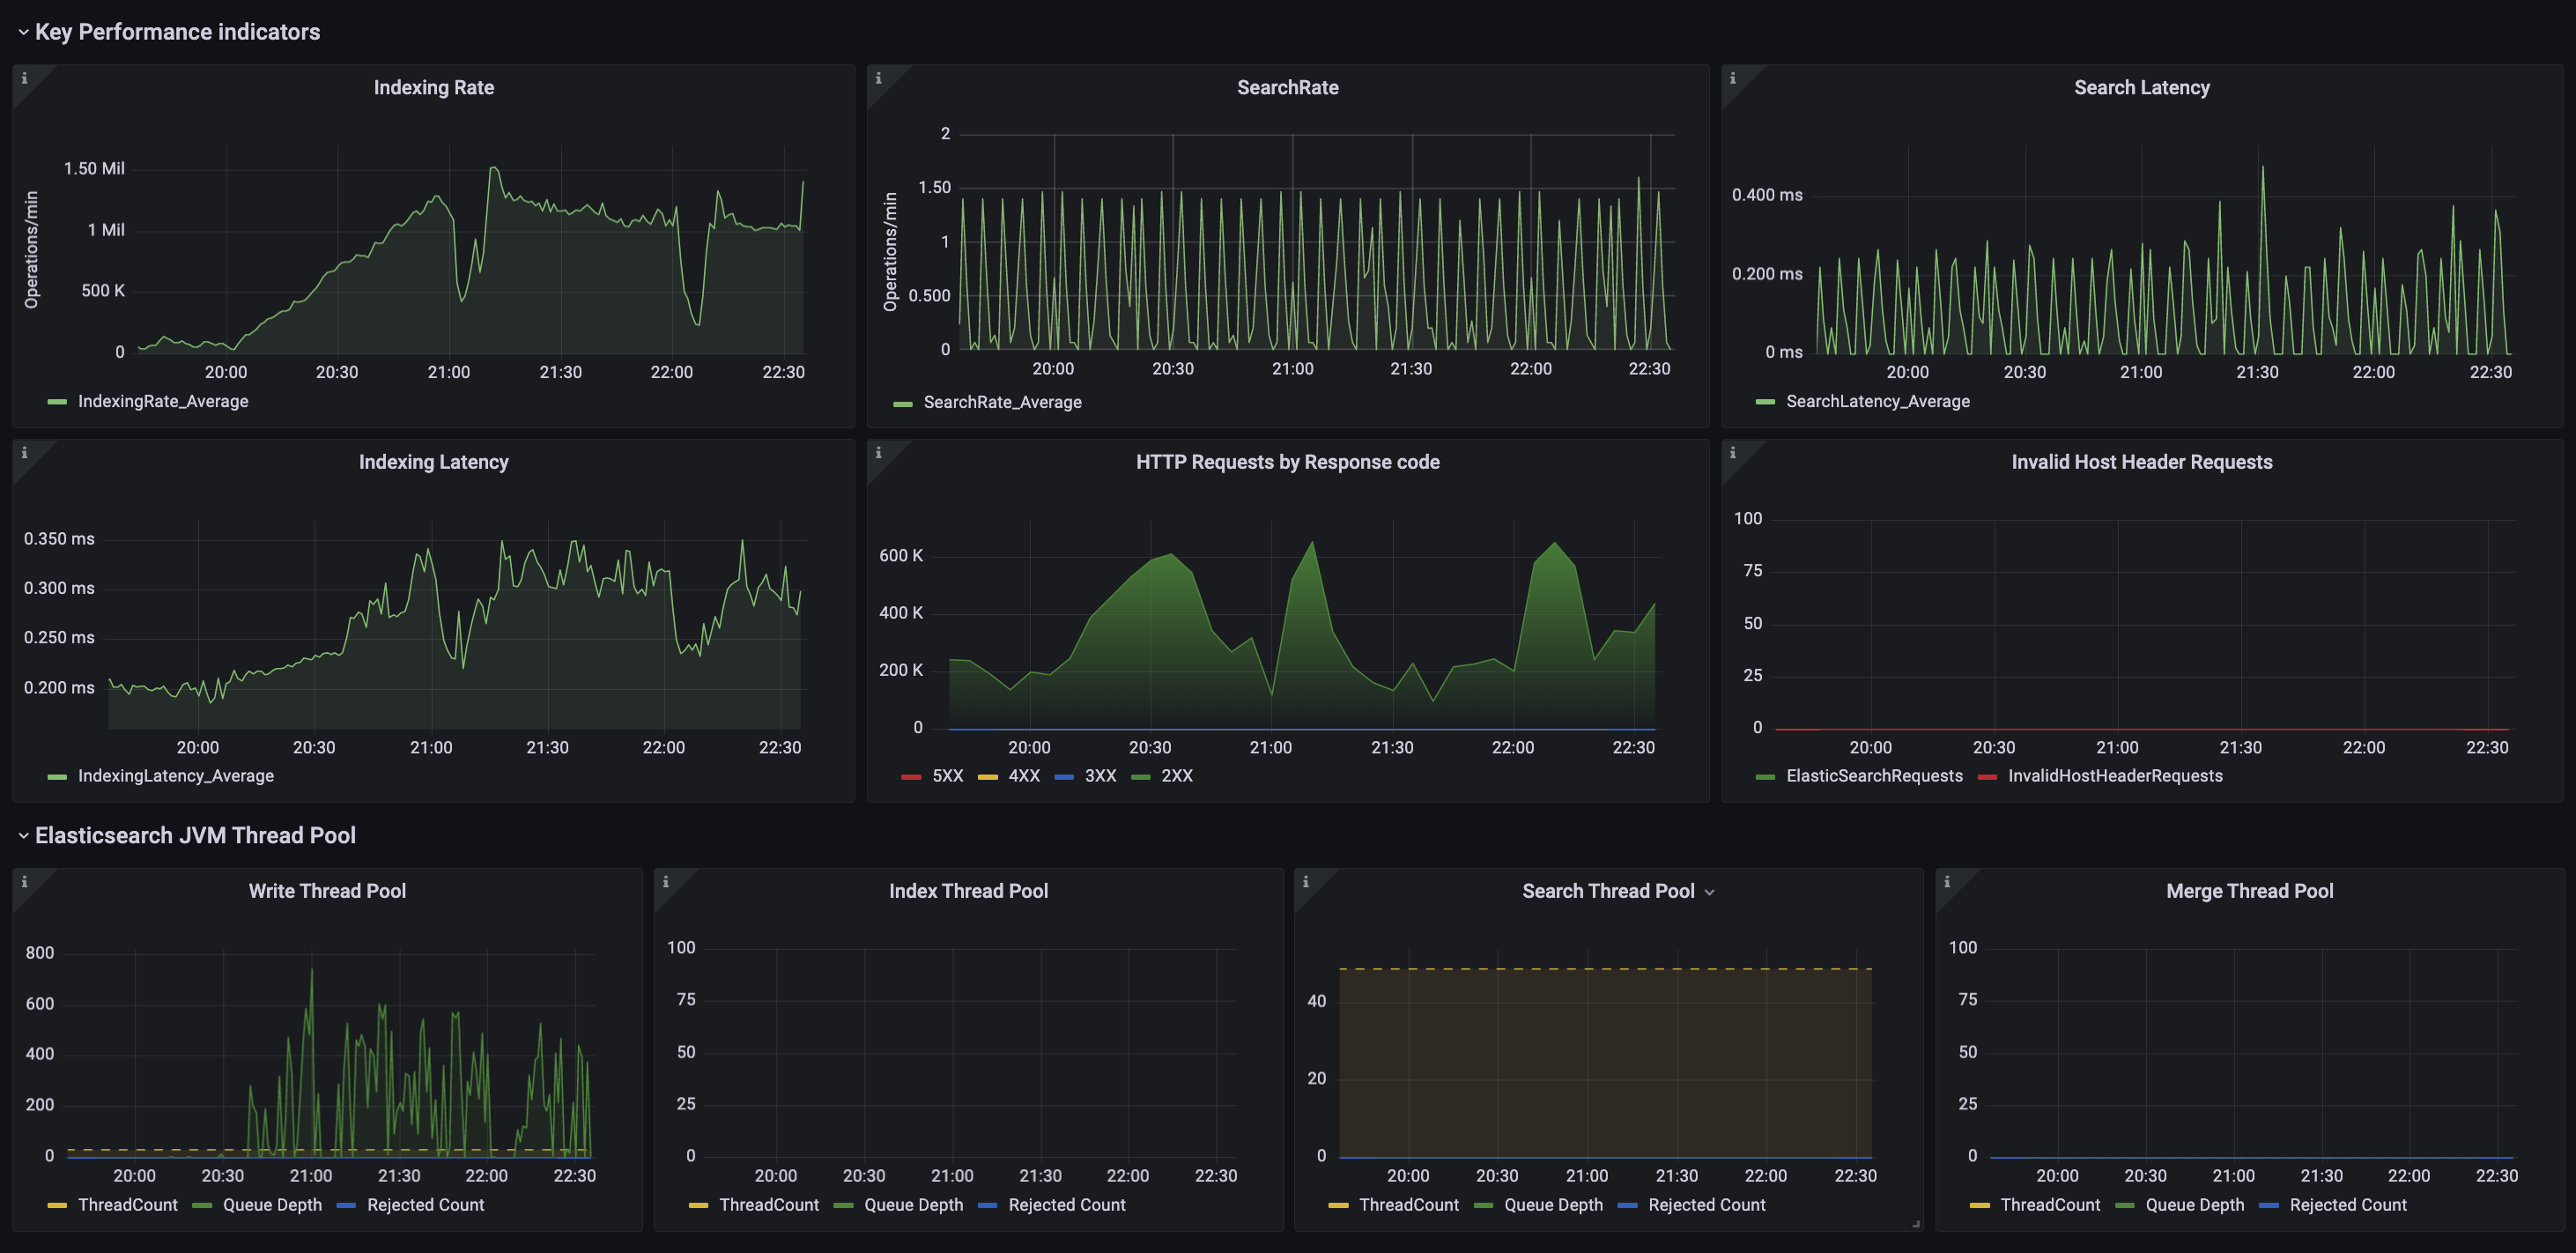
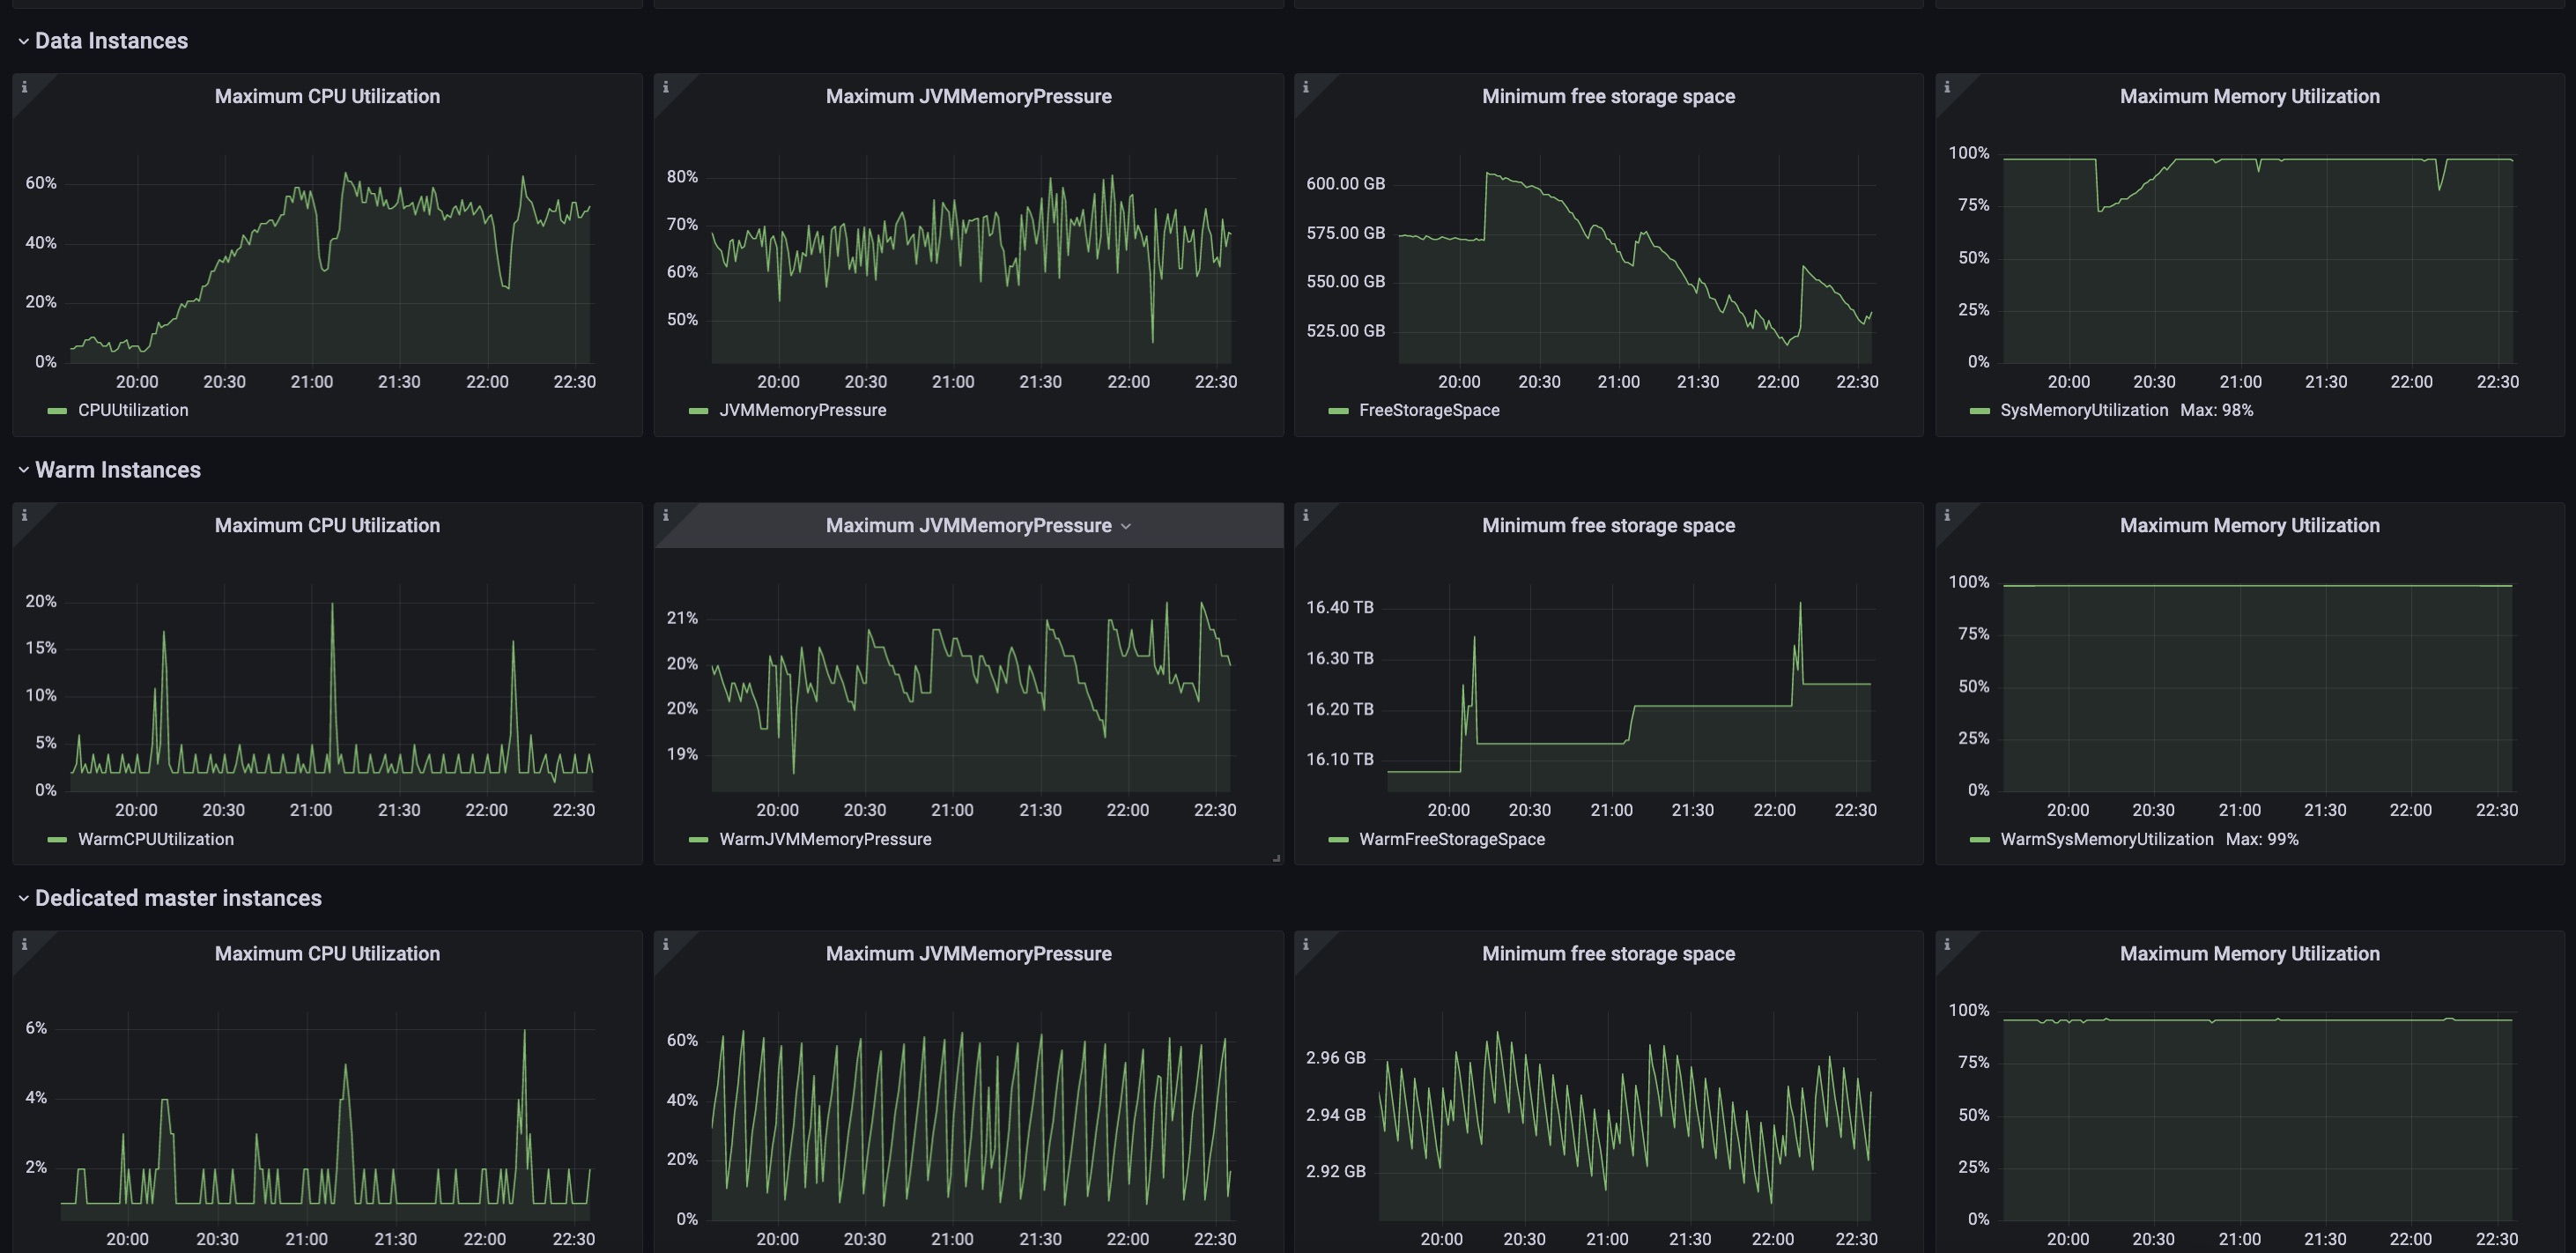
The AWS OpenSearch dashboard uses the cloudwatch data source to create a Grafana dashboard with the graph and timeseries panels.
Data source config
Collector type:
Collector plugins:
Collector config:
Revisions
Upload an updated version of an exported dashboard.json file from Grafana
| Revision | Description | Created | |
|---|---|---|---|
| Download |
AWS
Easily visualize and alert on more than 60 Amazon Web Services (AWS) resources using the fully managed Grafana Cloud platform.
Learn more