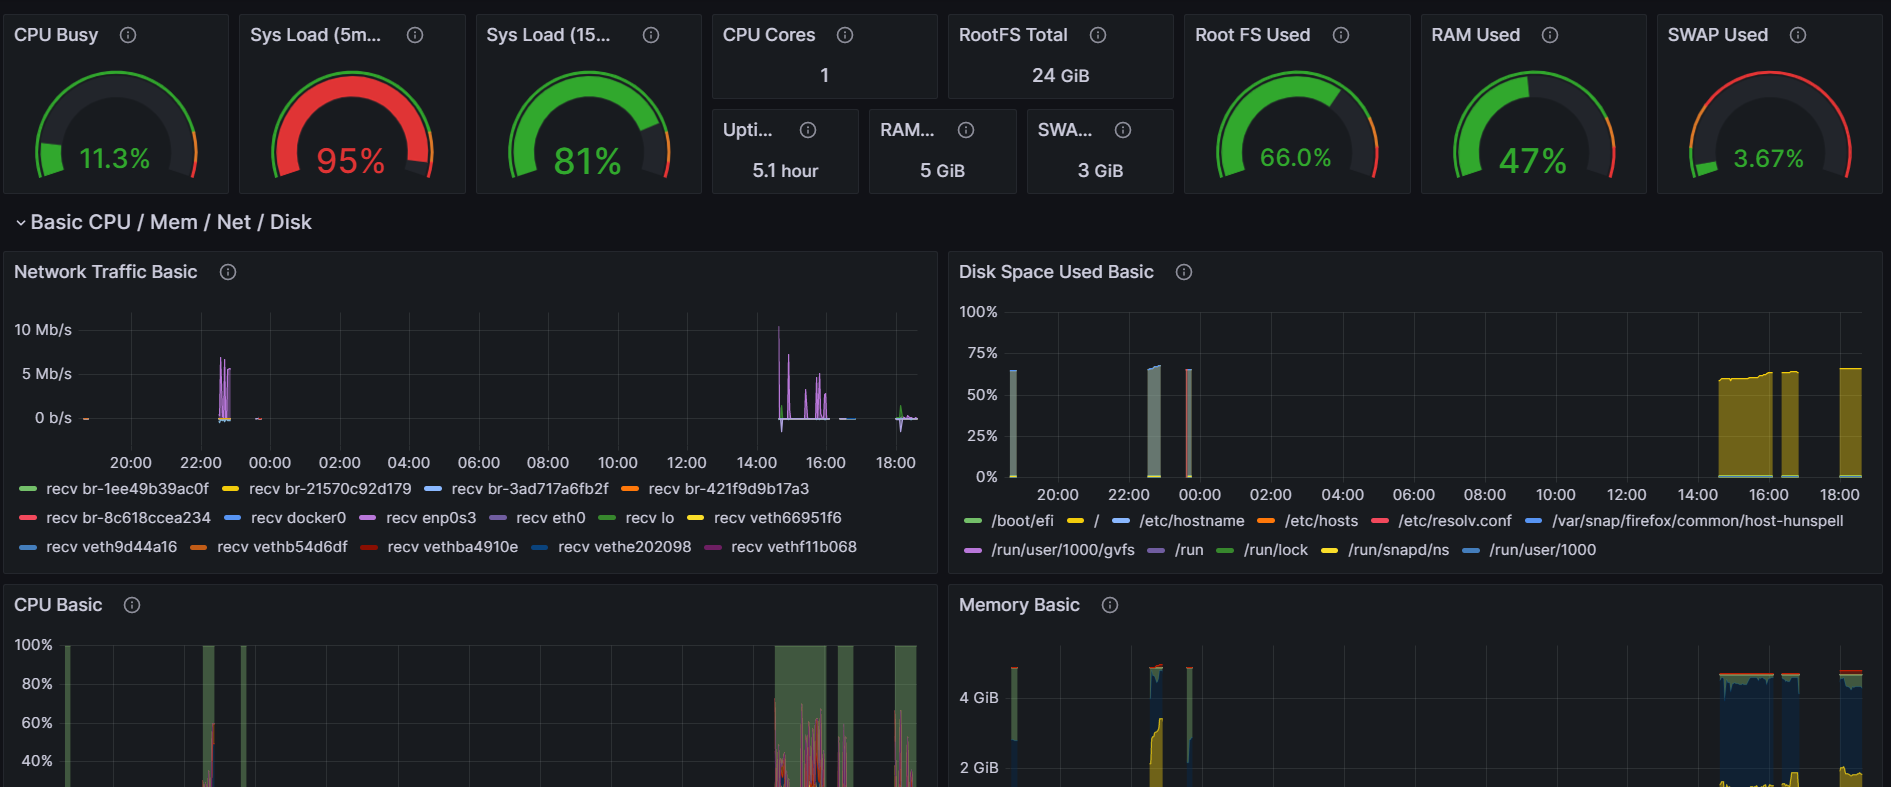
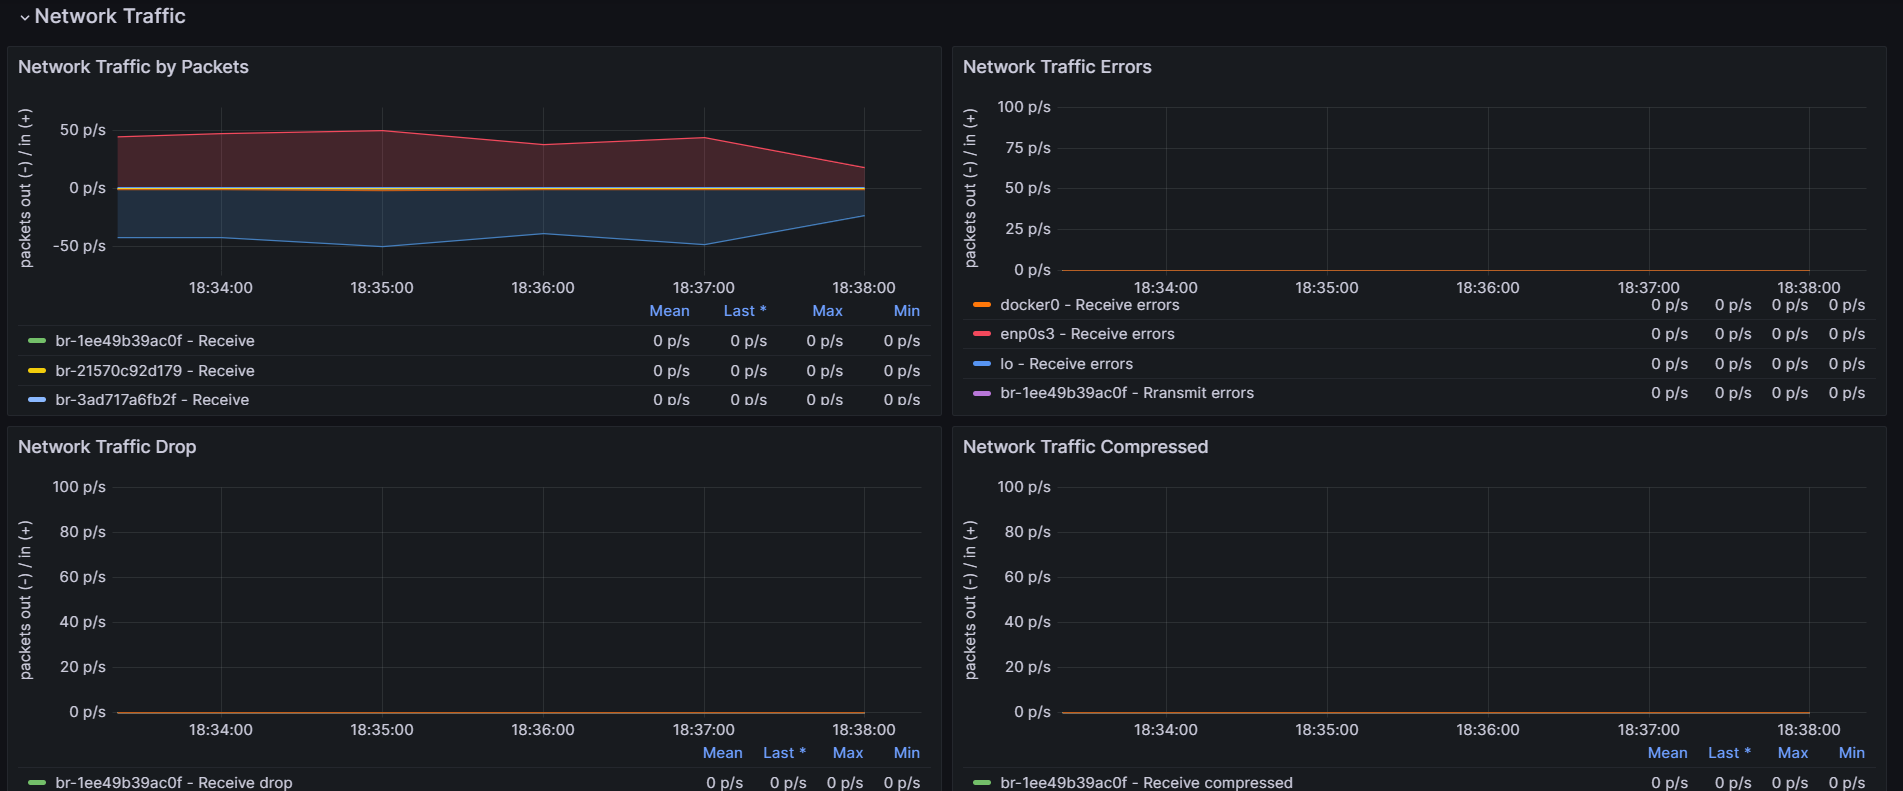
System Usage
Monitor Linux node : CPU, network traffic, memory status and system stats
Only requires the default job_name: node and target[addrs:portno] in prometheus.yml file. By default it take metrics form localhost:9100/metrics
  - job_name: node
    static_configs:
      - targets: ['localhost:9100']
If the metrics are available at a specific path other than the default, it needs to be defined in the configuration file.
scrape_configs:
  - job_name: "node"
    static_configs:
      - targets: ["localhost:9100"]
    metrics_path: "/some/path"
Recommended for prometheus-node-exporter the arguments ‘–collector.systemd –collector.processes’ because the graph uses some of their metrics
Data source config
Collector type:
Collector plugins:
Collector config:
Revisions
Upload an updated version of an exported dashboard.json file from Grafana
| Revision | Description | Created | |
|---|---|---|---|
| Download |