Dubbo Application Dashboard
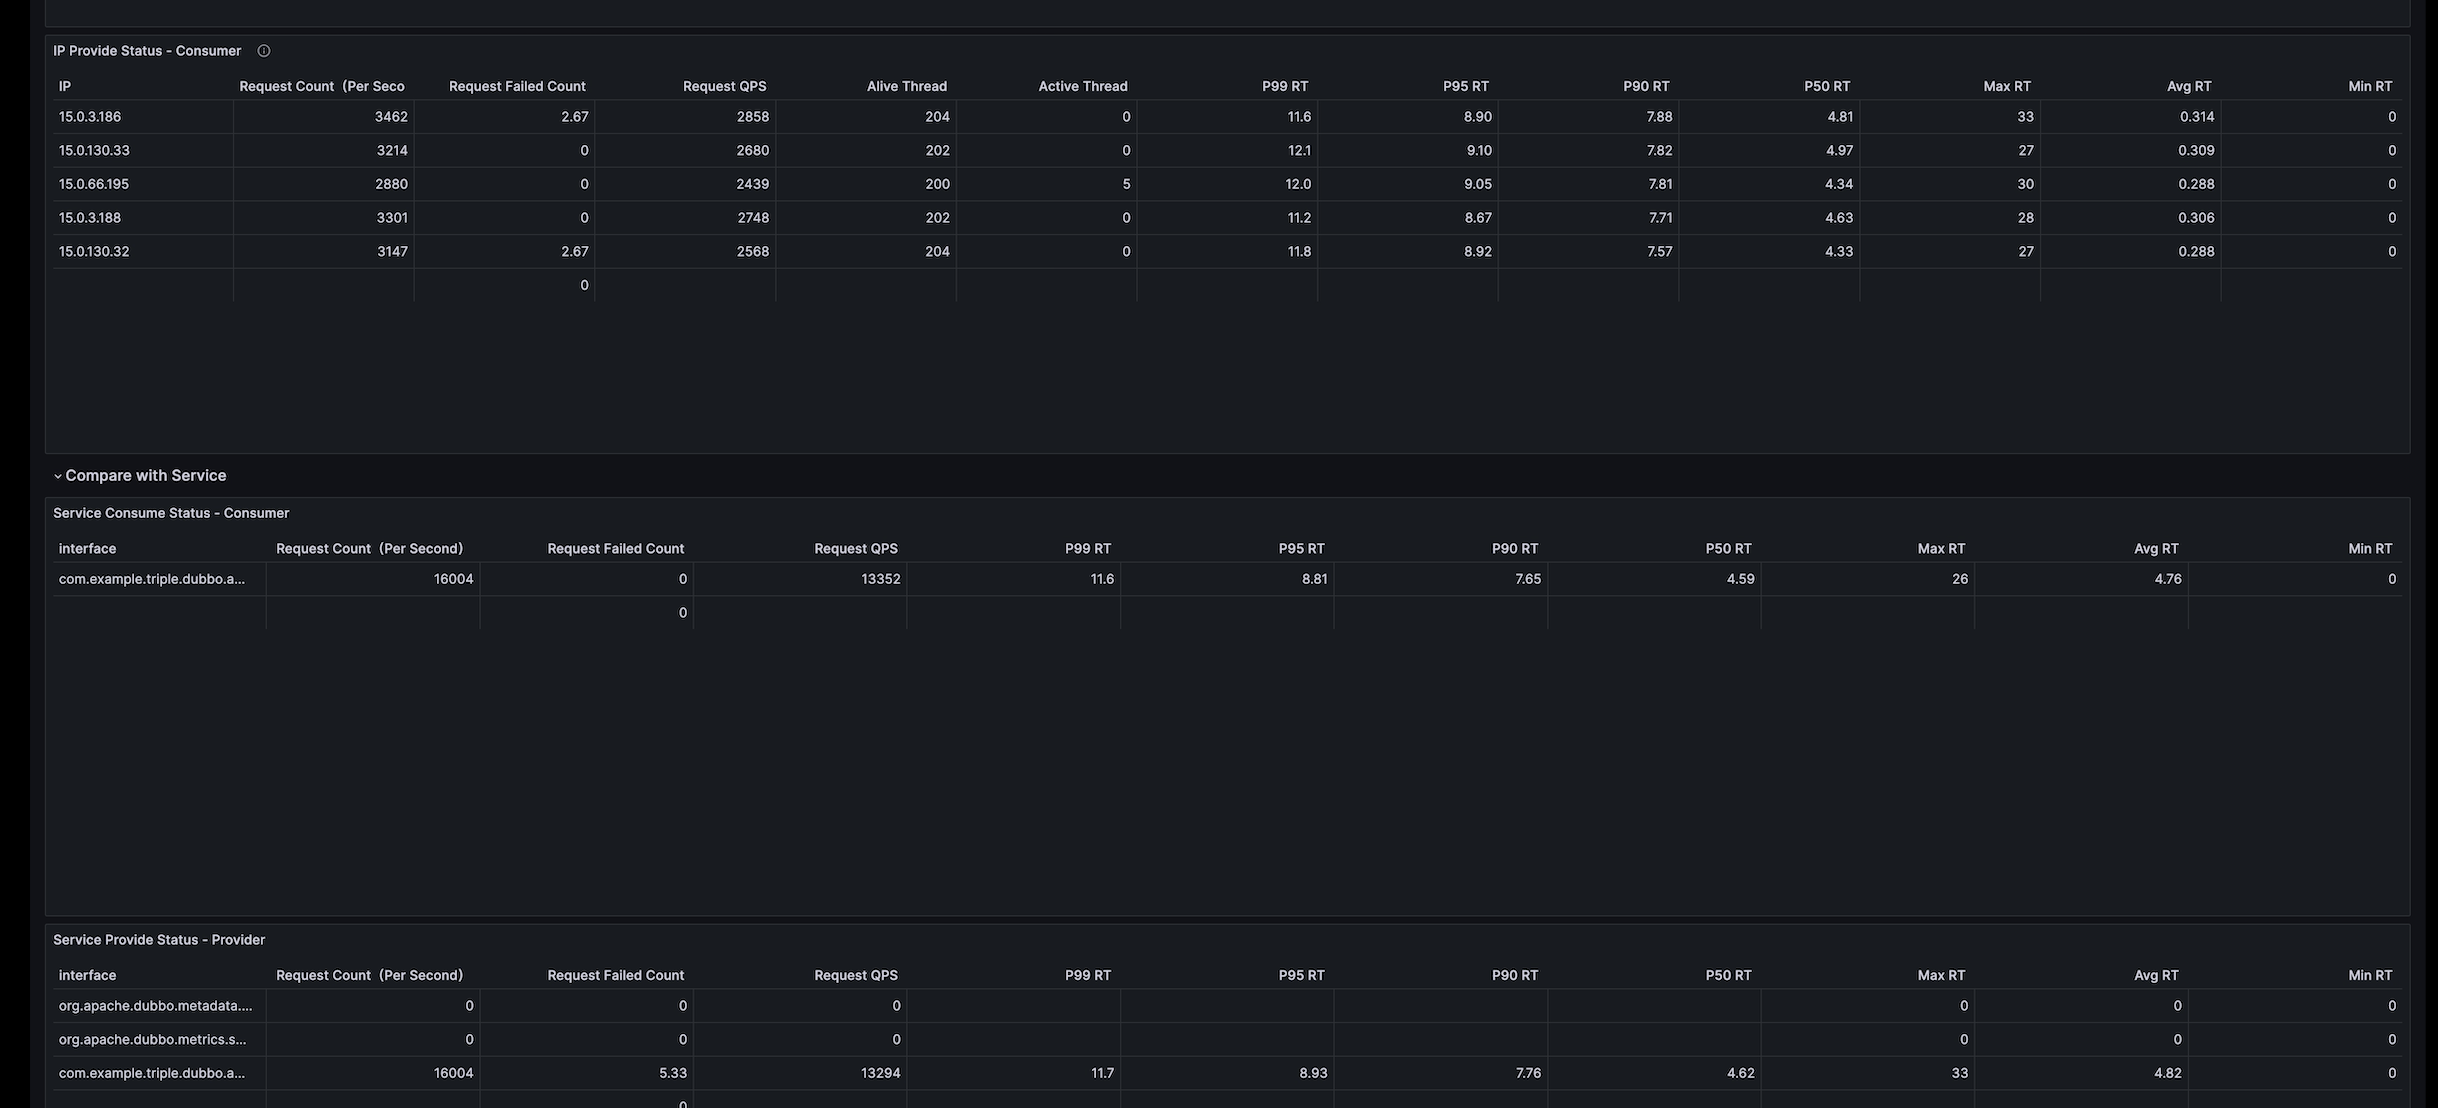
The key indicators of Dubbo include latency, traffic, errors, and saturation. At the same time, in order to better monitor the running status of the service, Dubbo also provides monitoring of the status of core components, such as Dubbo application information, thread pool information, and indicator data interacting with the three centers.
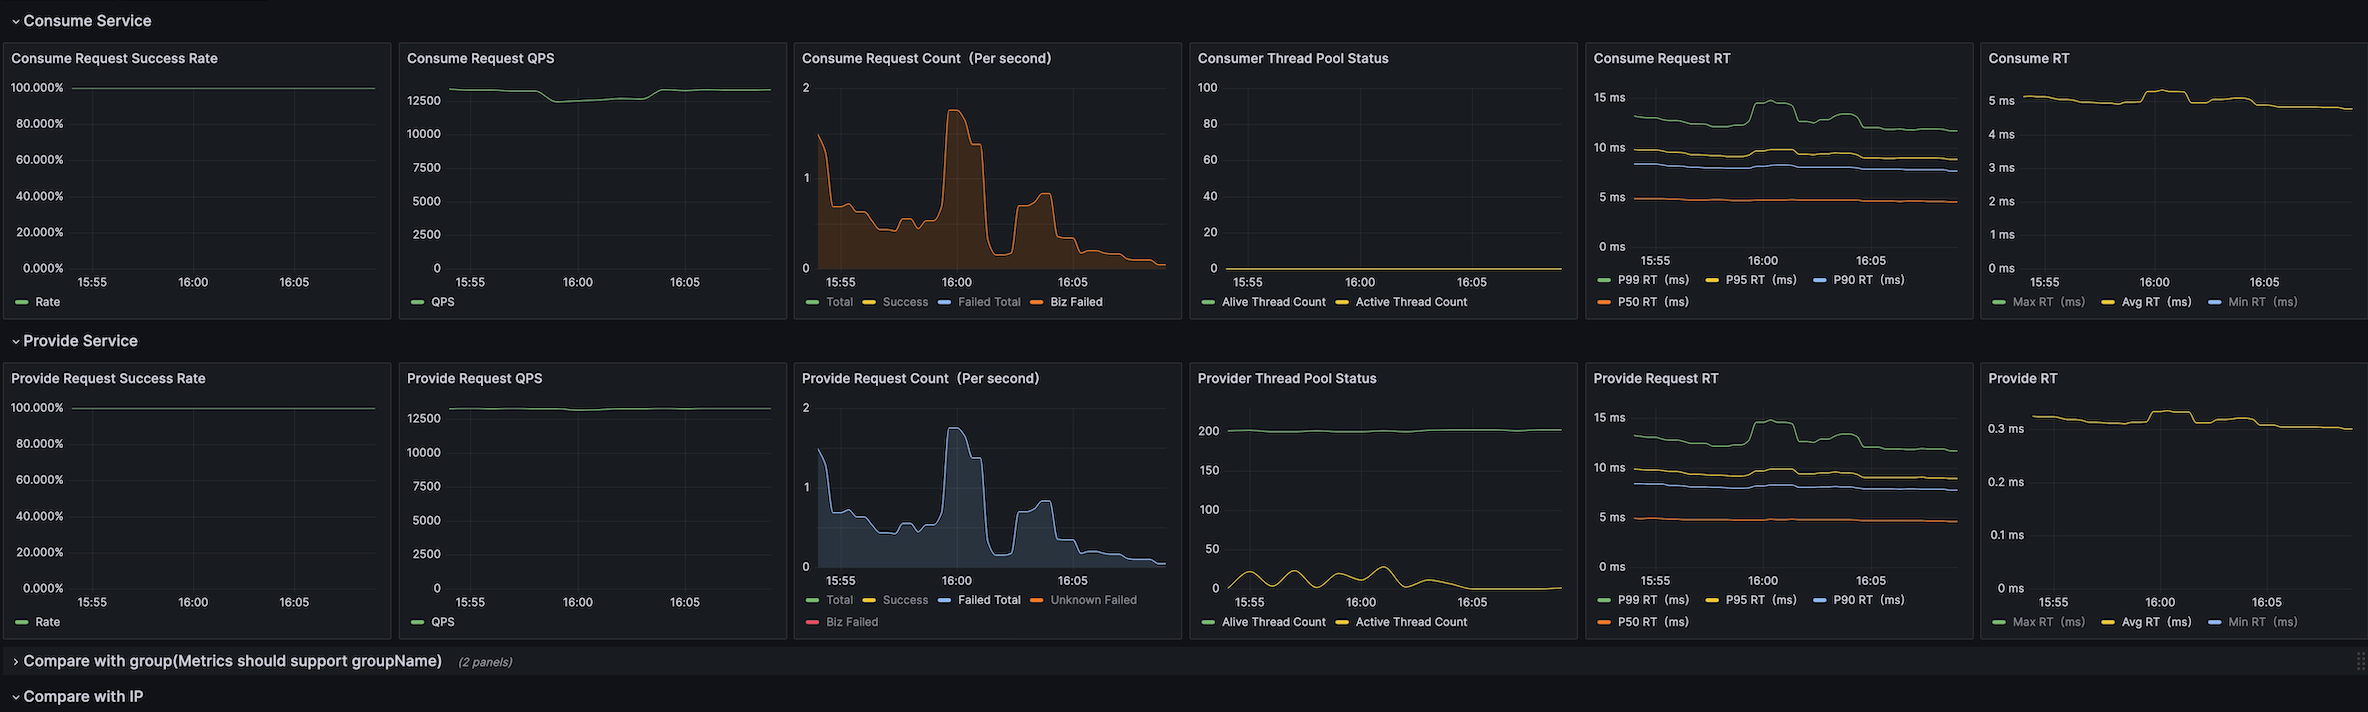
The key indicators of Dubbo include latency, traffic, errors, and saturation. At the same time, in order to better monitor the running status of the service, Dubbo also provides monitoring of the status of core components, such as Dubbo application information, thread pool information, and indicator data interacting with the three centers.
Data source config
Collector config:
Upload an updated version of an exported dashboard.json file from Grafana
| Revision | Description | Created | |
|---|---|---|---|
| Download |