Tado + Tuya thermostat data
Dashboard which uses the data from https://github.com/eko/tado-exporter and https://github.com/acoster/tuya-exporter to display temperature, humidity and heating status.
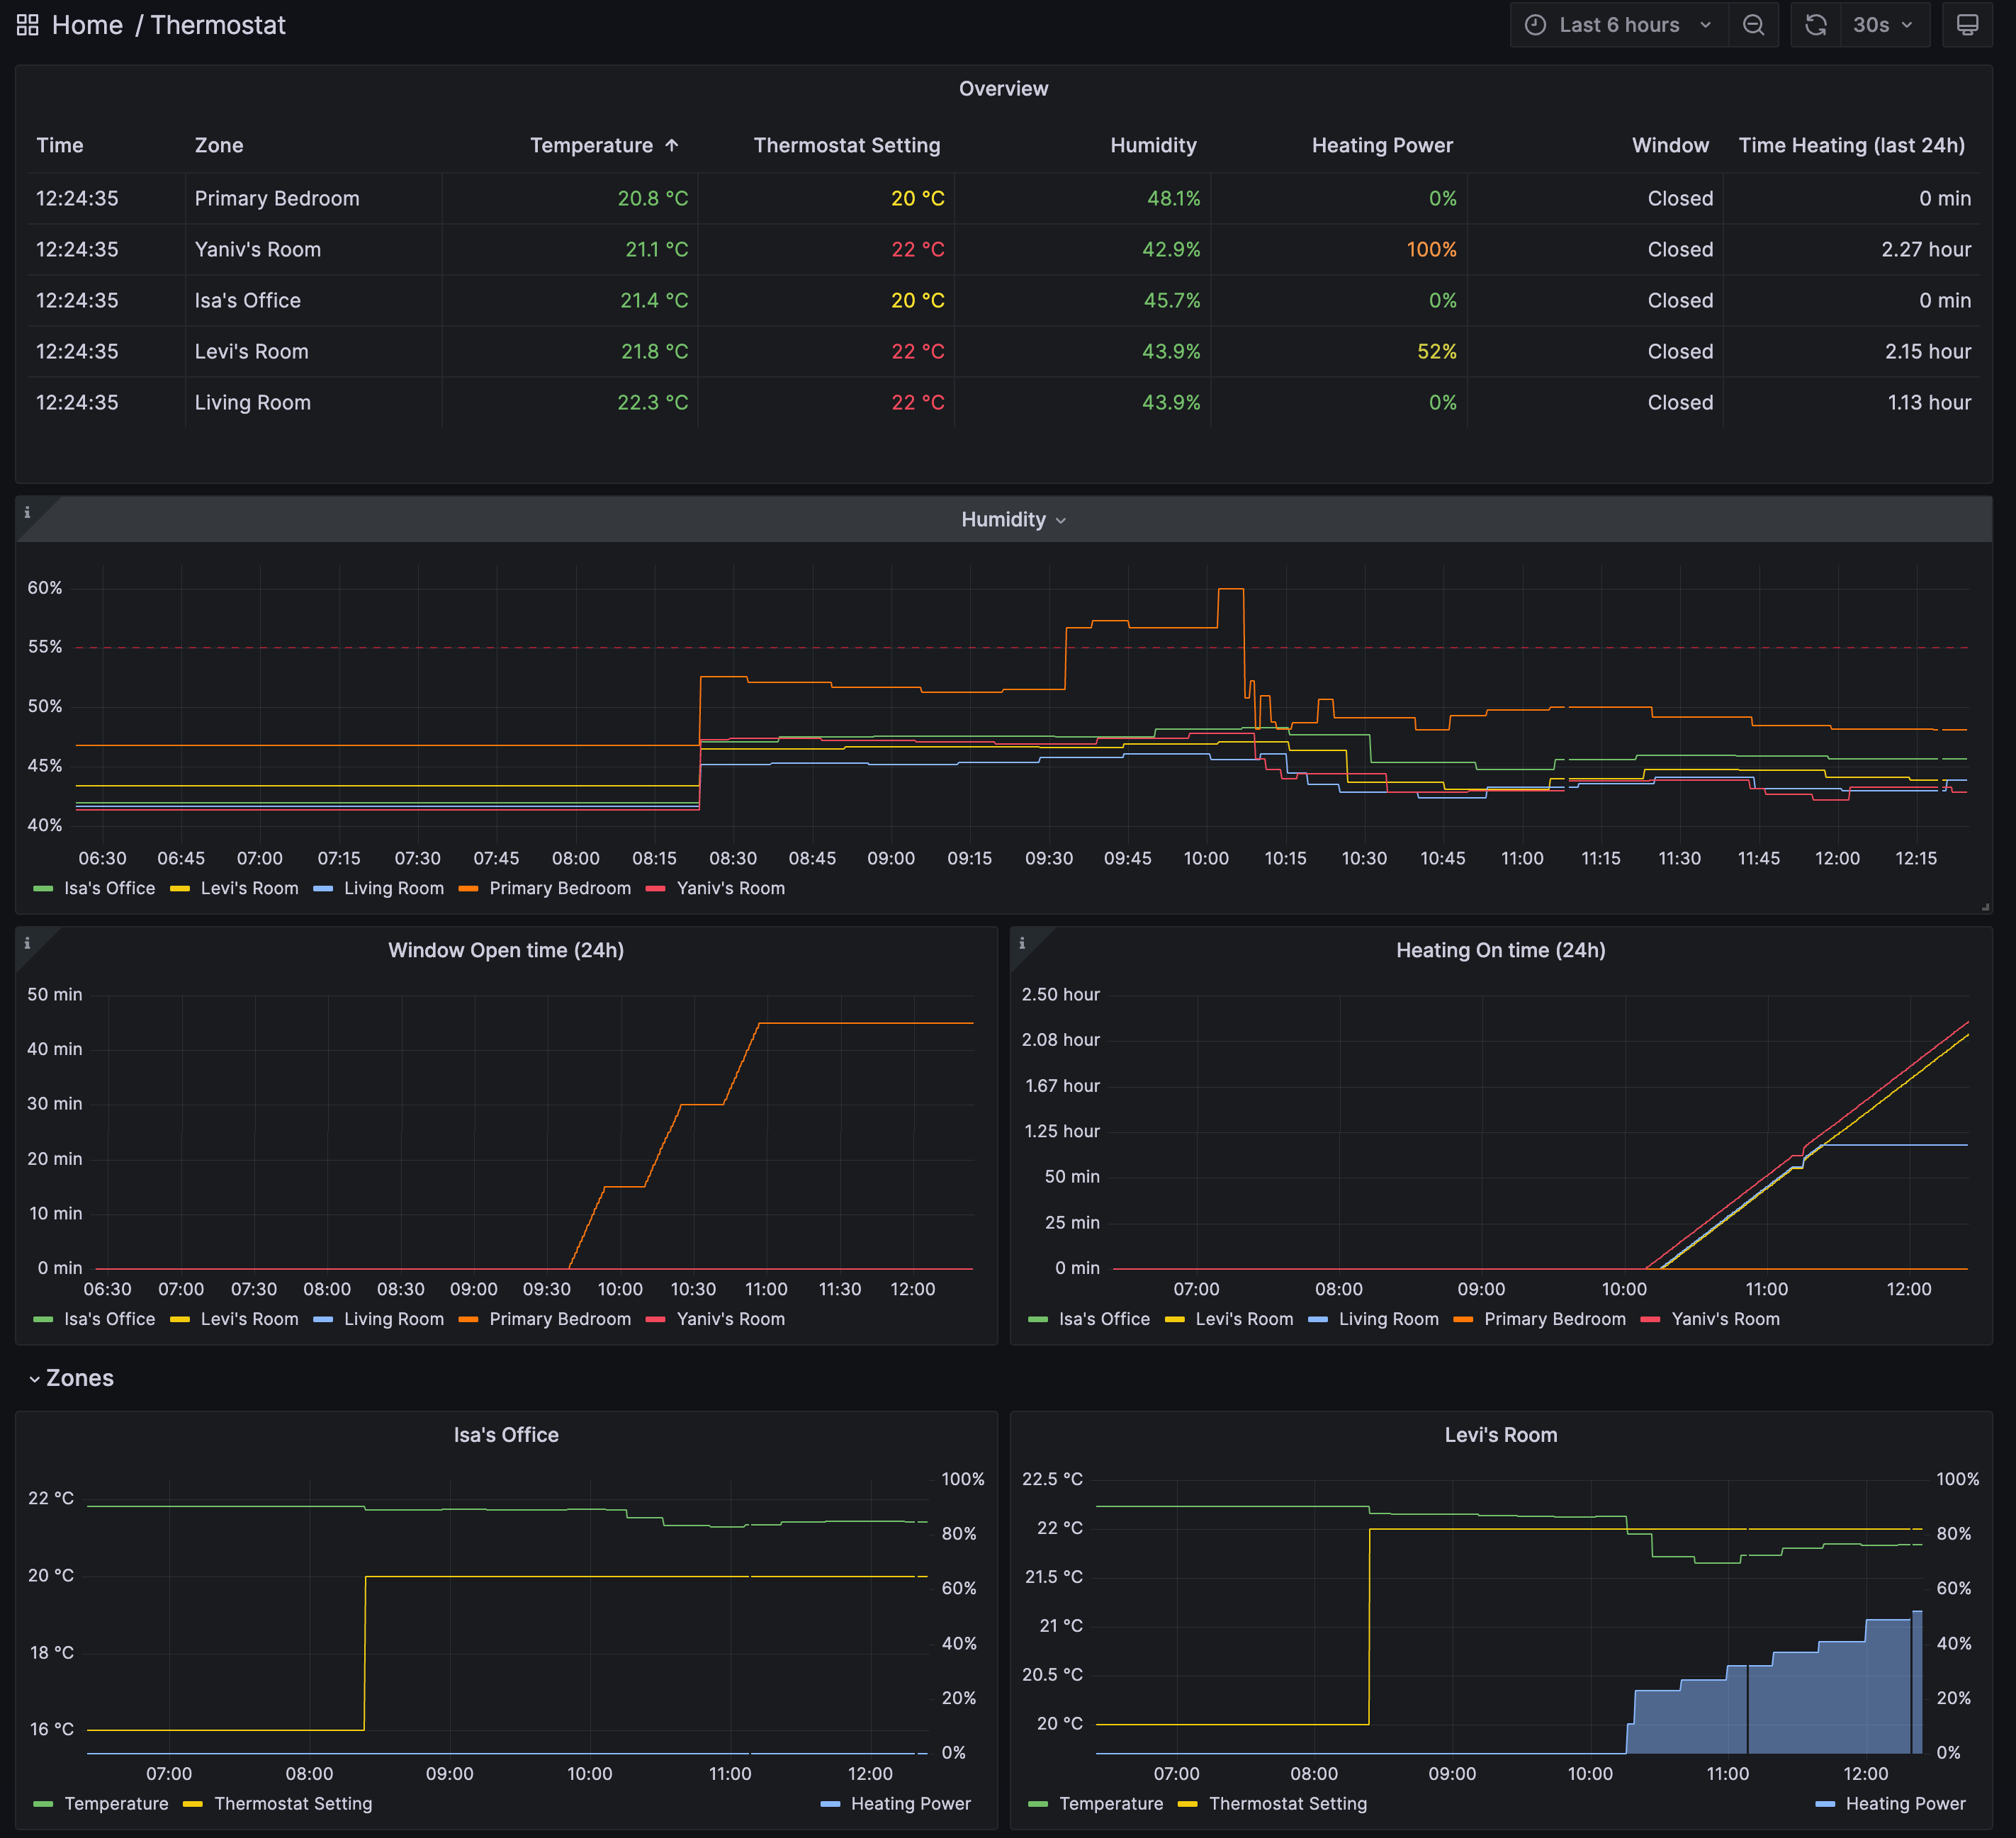
Uses data collected by https://github.com/eko/tado-exporter and https://github.com/acoster/tuya-exporter to display temperature, humidity and heating status.
To have the 24h aggregation displayed, the following computation rule must be added to Prometheus:
groups:
  - name: agg24h
    rules:
      - record: zone:tado_minutes_heating_on:24h
        expr: sum_over_time(((sum(tado_activity_heating_power_percentage) by (zone)) > bool 0)[24h:1m])
      - record: zone:tado_minutes_window_open:24h
        expr: sum_over_time(tado_sensor_window_opened[24h:1m])
Data source config
Collector type:
Collector plugins:
Collector config:
Revisions
Upload an updated version of an exported dashboard.json file from Grafana
| Revision | Description | Created | |
|---|---|---|---|
| Download |