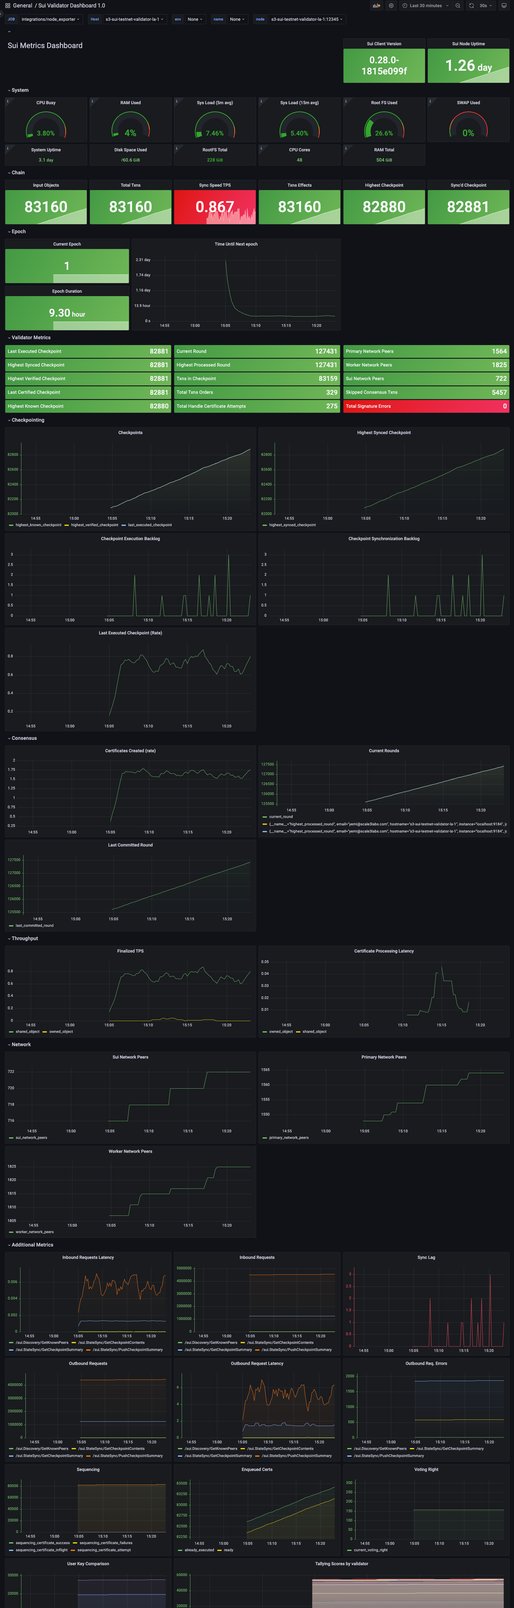
Sui Validator Dashboard 1.0
Sui Validator Node dashboard. Uses Grafana agent with node exporter plugin/integration enabled.
- Automatically setup this dashboard by signing up for autopilot from Scale3Labs
- You can use this dashboard with Grafana agent or in your prometheus.yml
- When using with Grafana agent ensure node exporter integration is enabled. Example config.yaml
server:
  log_level: info
metrics:
  wal_directory: "/var/lib/grafana"
  global:
    scrape_interval: 15s
    remote_write:
      - url: https://domain.com/api/v1/write
  configs:
  - name: "sui"
    scrape_configs:
      - job_name: "sui Metrics"
        honor_timestamps: false
        static_configs:
          - targets: ["localhost:9184"]
integrations:
  agent:
    enabled: false
  node_exporter:
    enabled: true
- Drop us a message if you run into any issues or have questions. contact@scale3labs.com
Data source config
Collector type:
Collector plugins:
Collector config:
Revisions
Upload an updated version of an exported dashboard.json file from Grafana
| Revision | Description | Created | |
|---|---|---|---|
| Download |