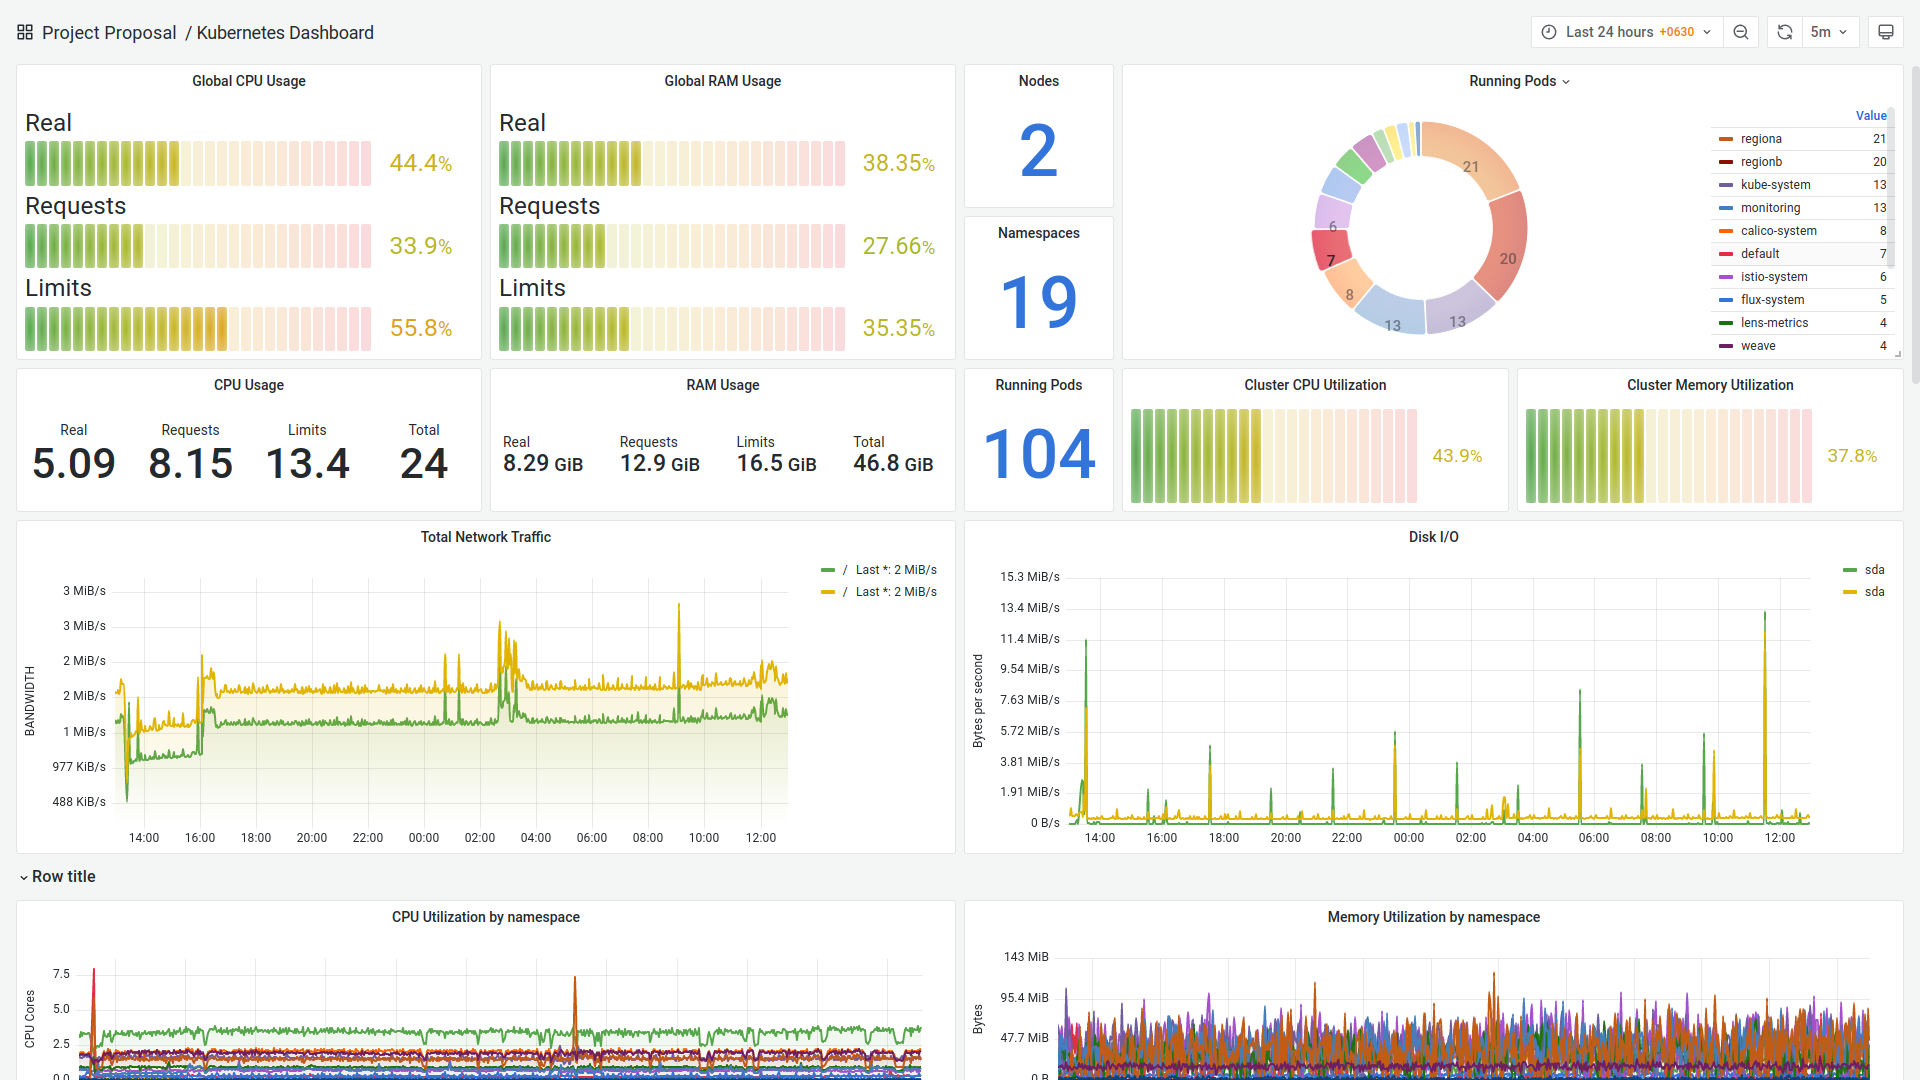
Kubernetes Dashboard
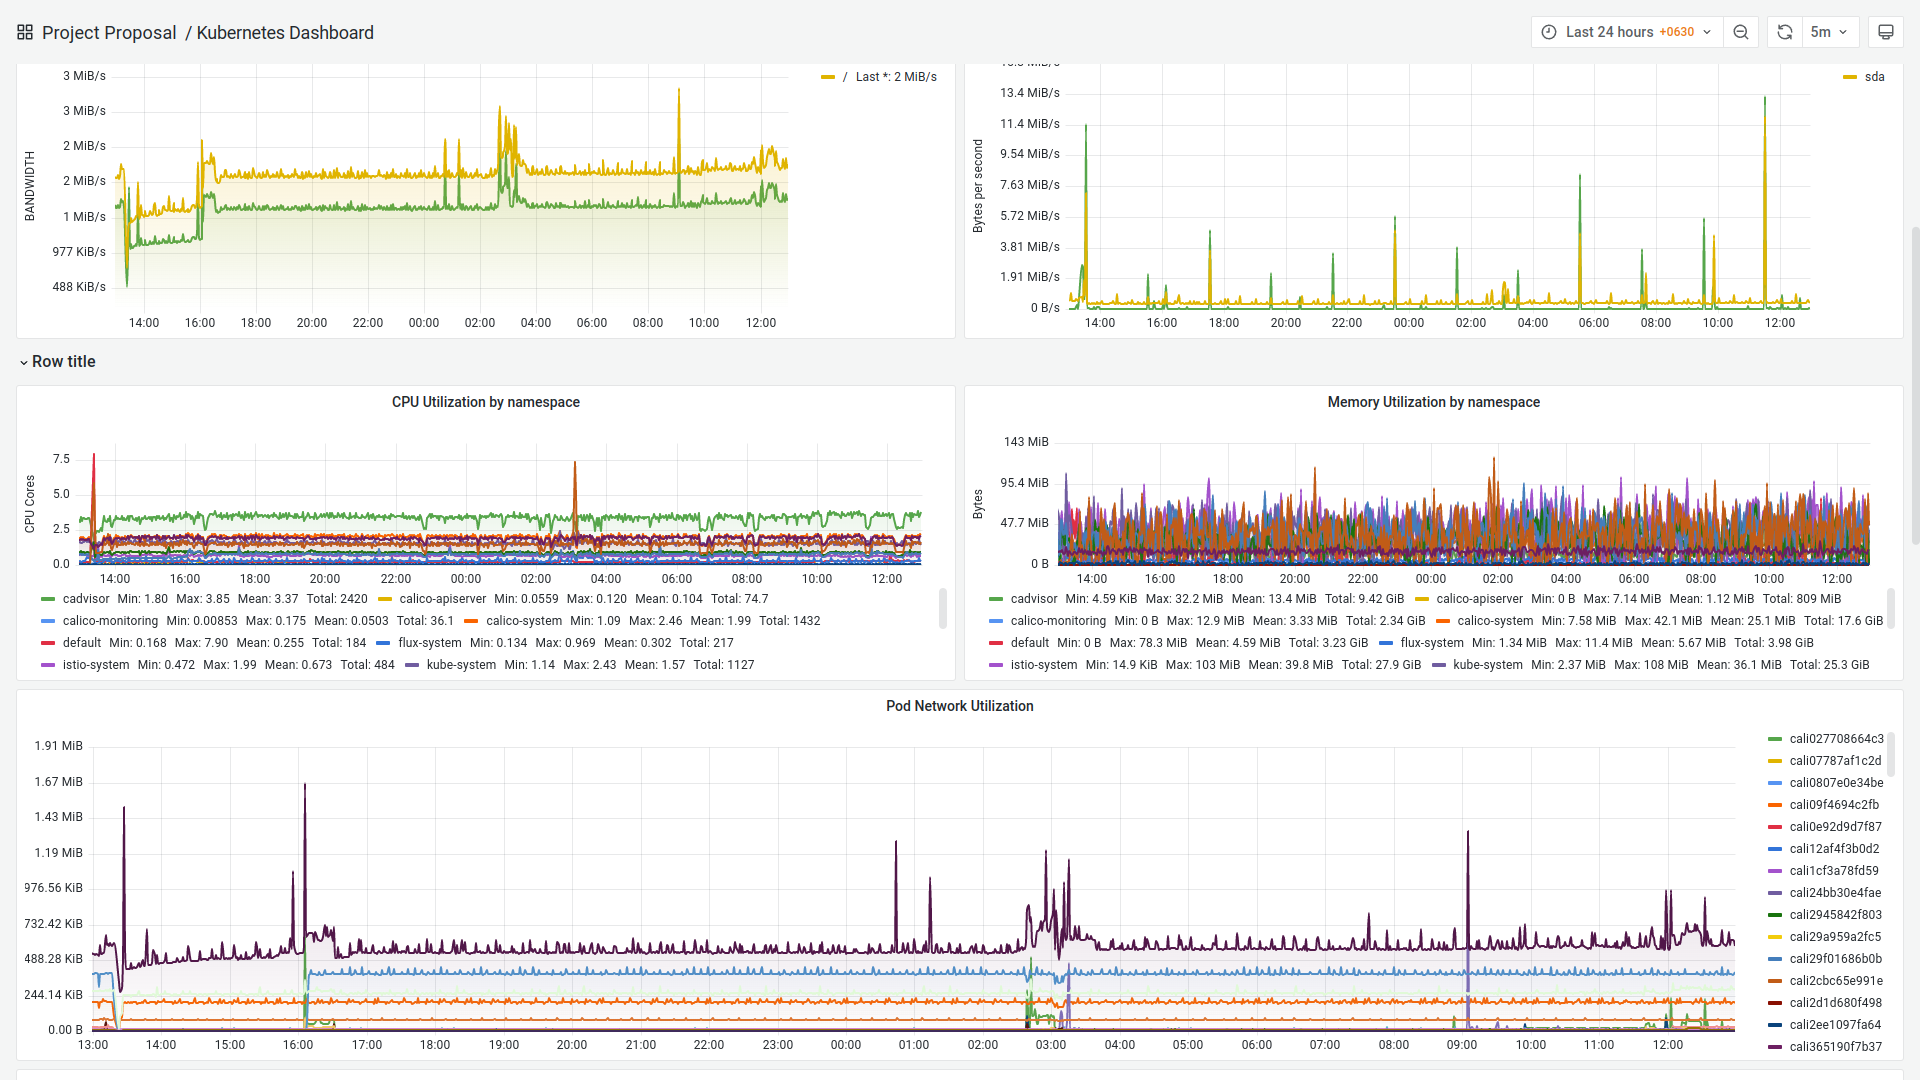
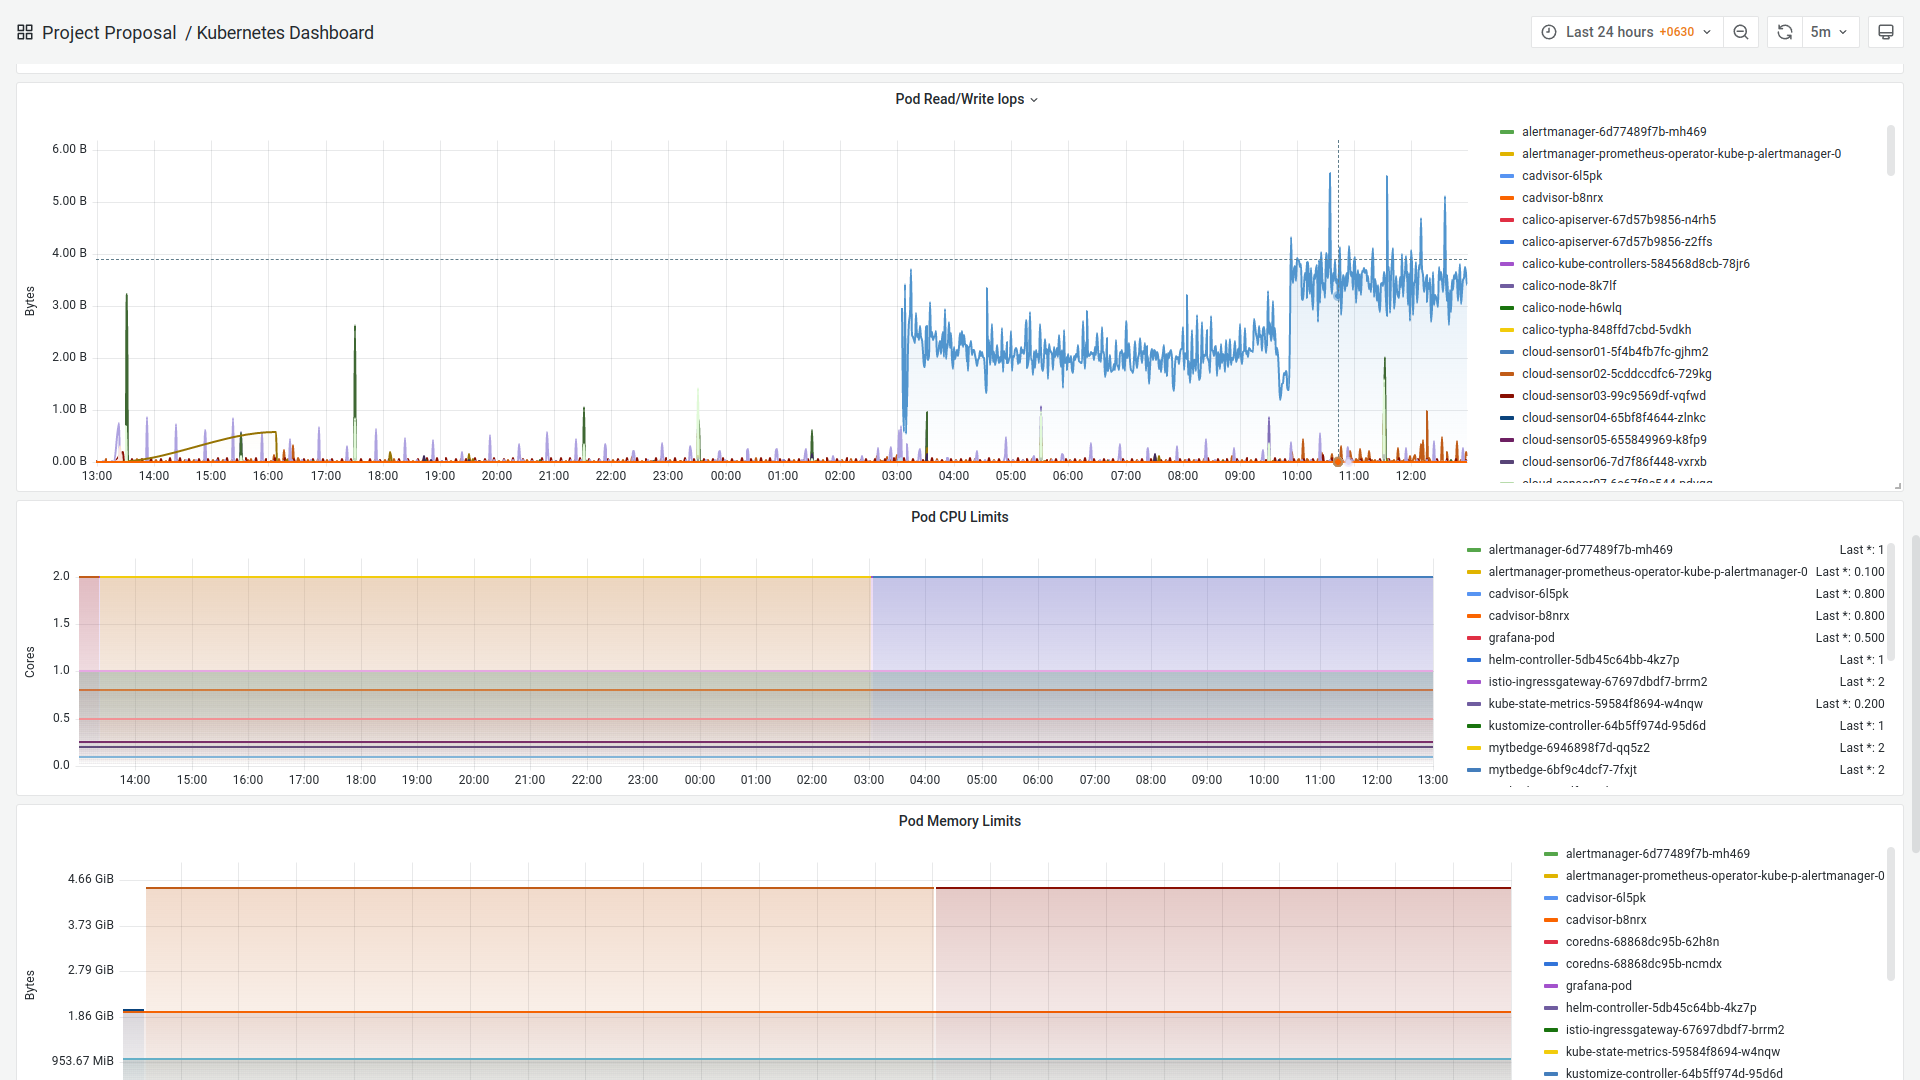
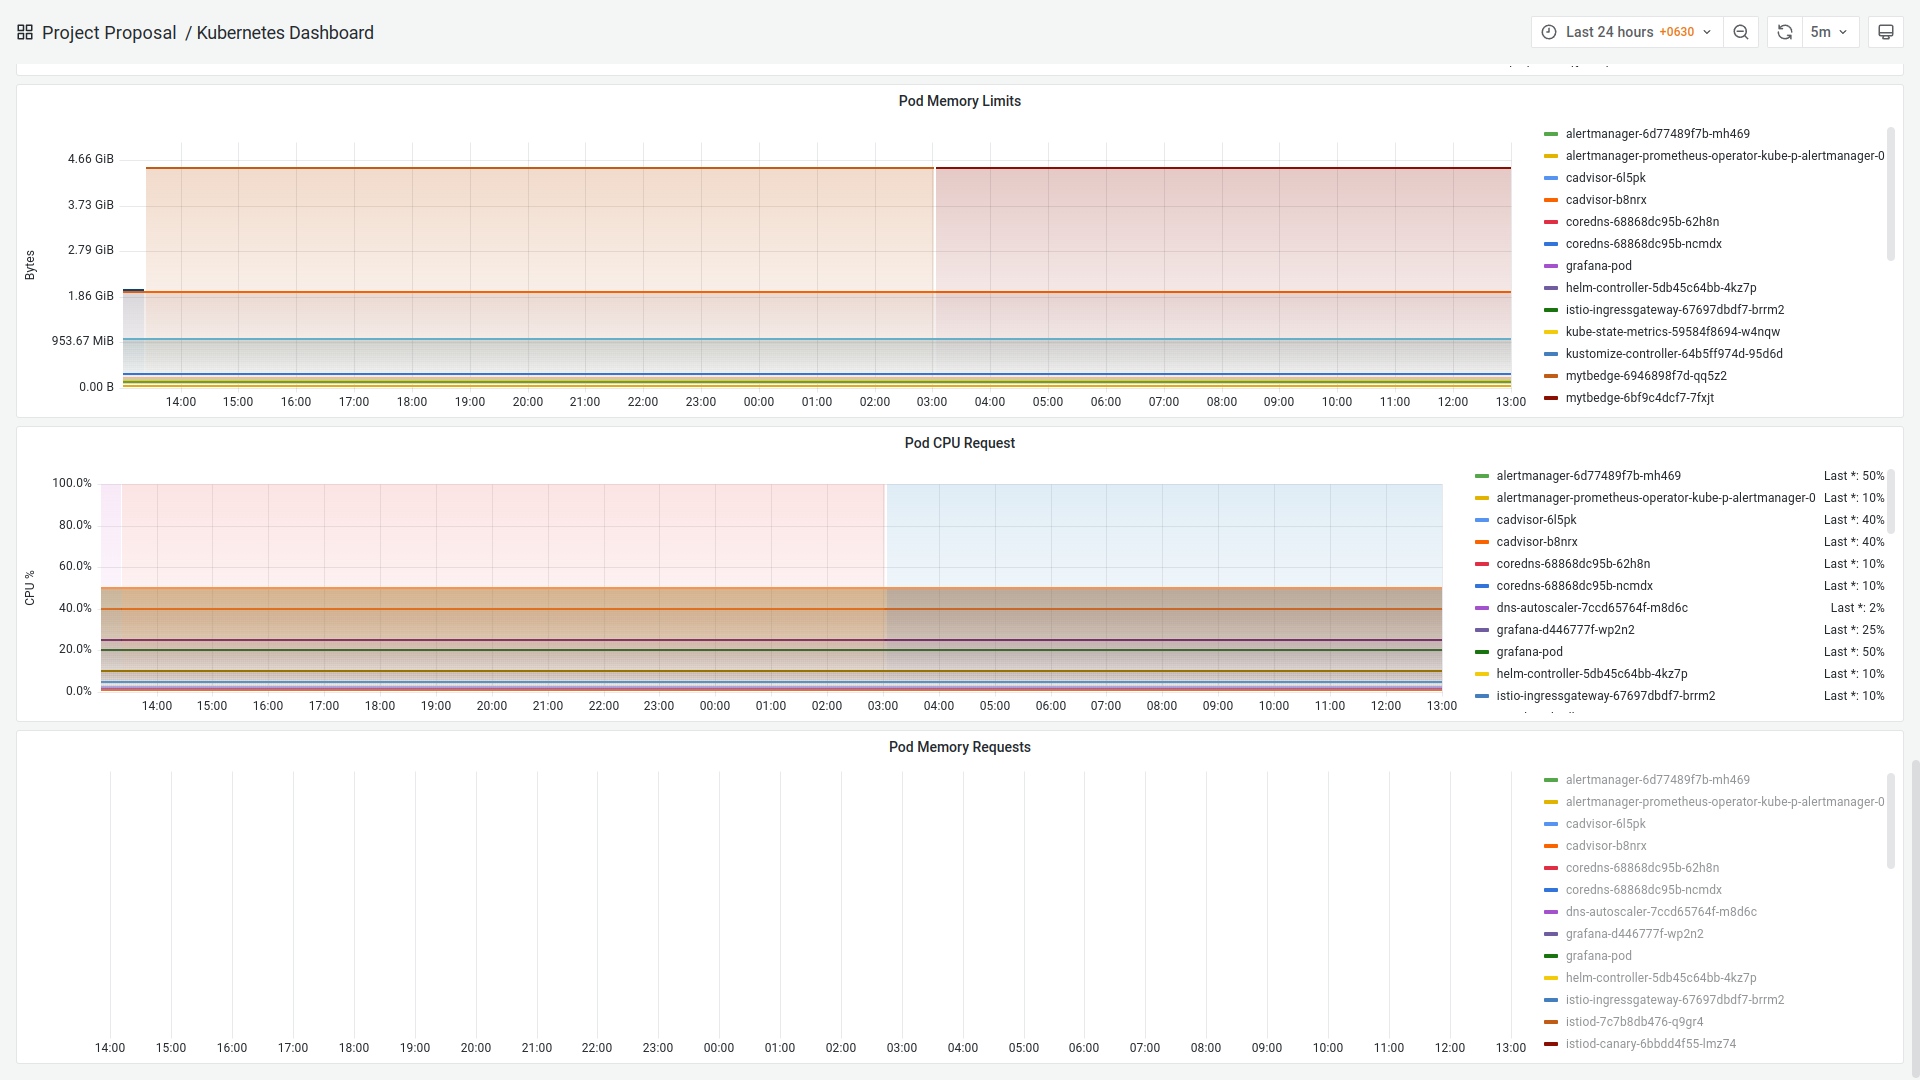
to monitor pod cpu, memory, I/O, RX/TX and cluster cpu, memory request/limit/real usage, RX/TX, Disk I/O
hello
Data source config
Collector type:
Collector plugins:
Collector config:
Revisions
Upload an updated version of an exported dashboard.json file from Grafana
| Revision | Description | Created | |
|---|---|---|---|
| Download |
Kubernetes
Monitor your Kubernetes deployment with prebuilt visualizations that allow you to drill down from a high-level cluster overview to pod-specific details in minutes.
Learn more