Prometheus Server with Sensors
Dashboard based on https://github.com/starsliao/Prometheus
Dashboard based on https://github.com/starsliao/Prometheus
Requirements:
- Grafana
- Prometheus
- Node Exporter
- Linux Monitoring Sensors (lm_sensors)
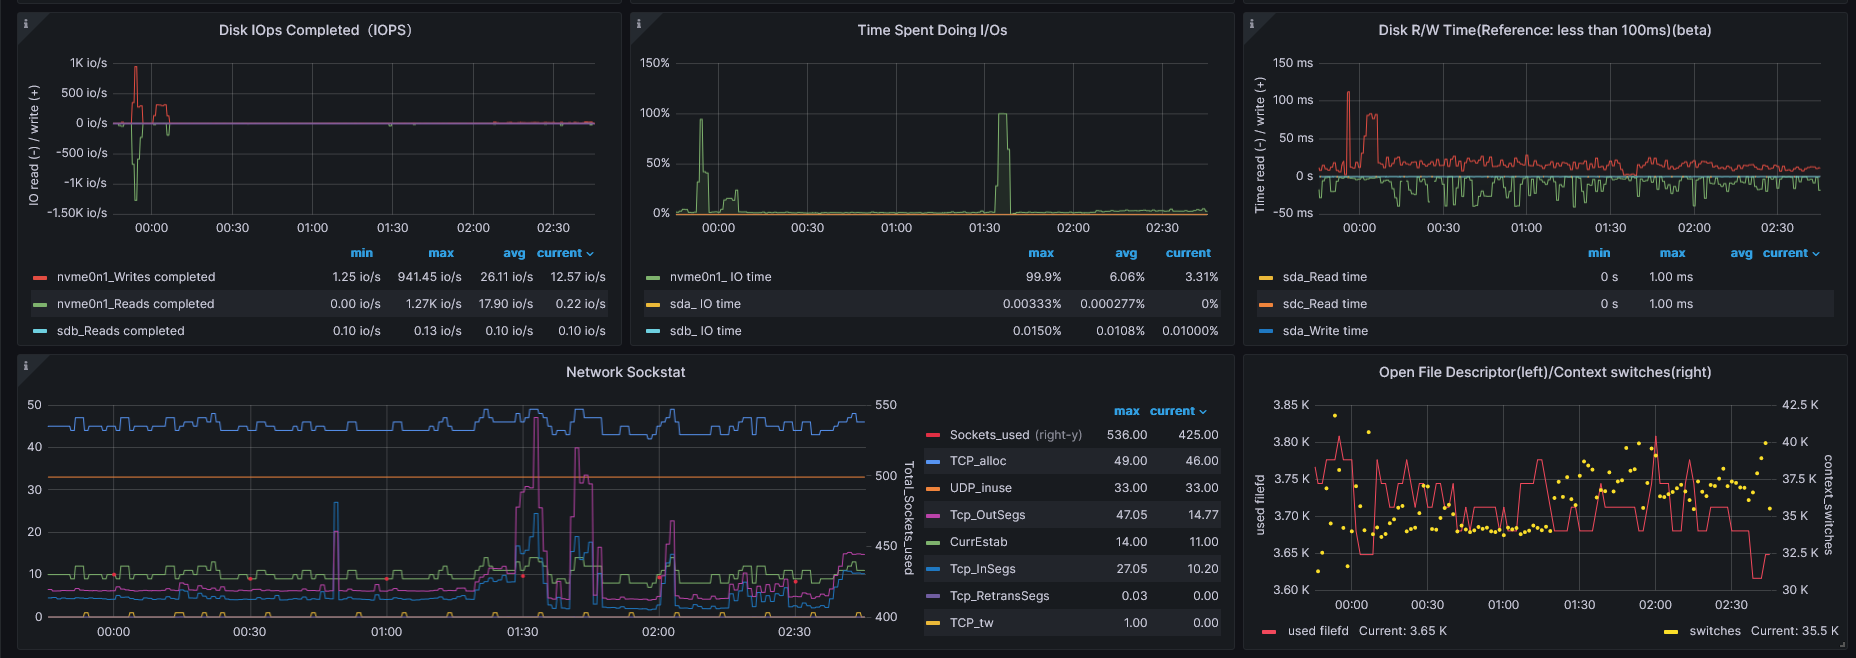
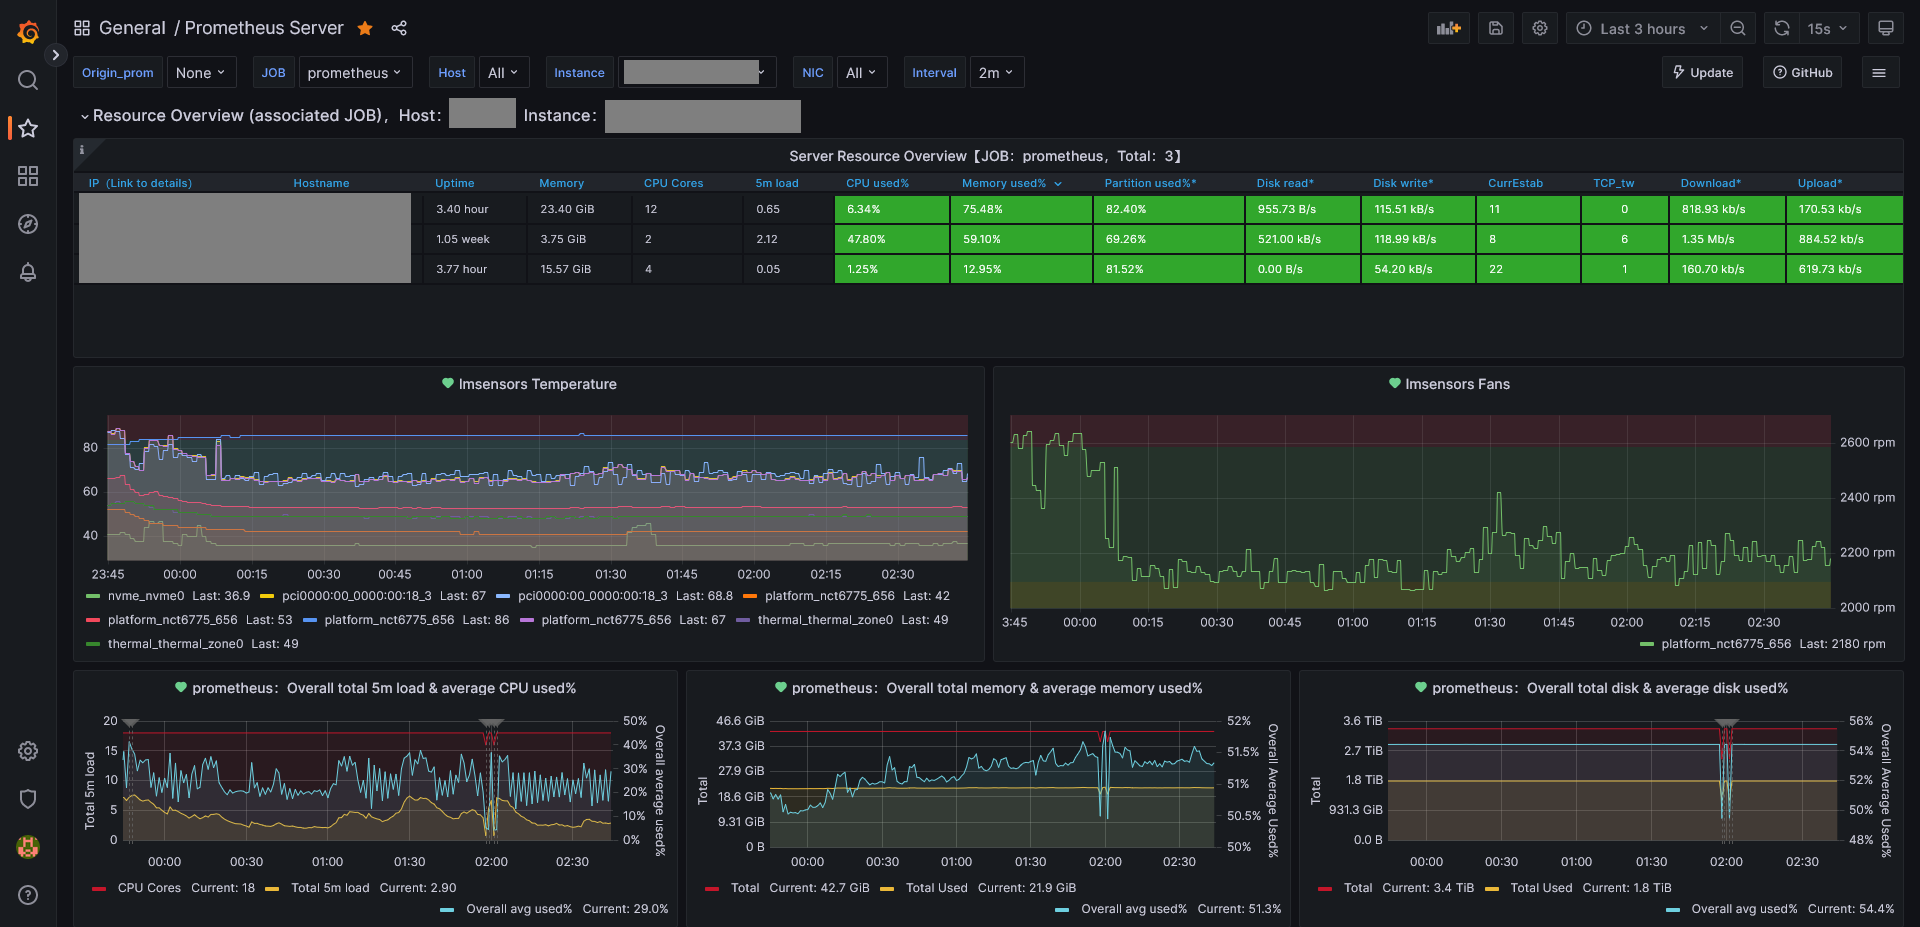
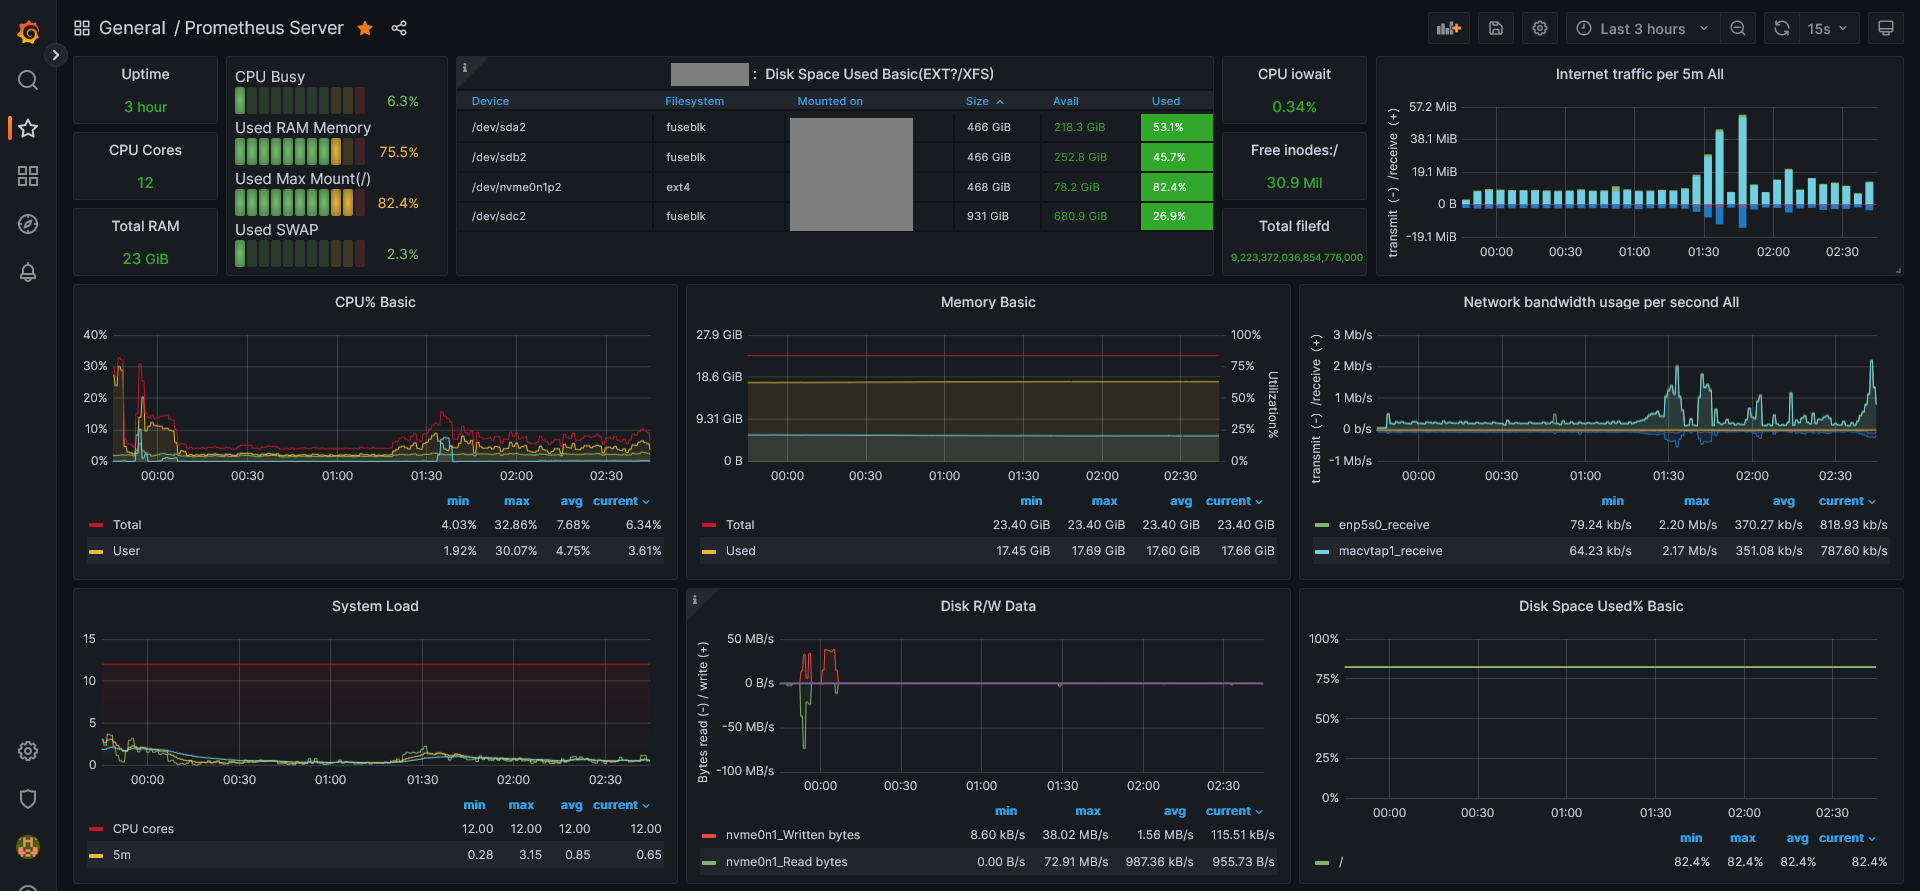
Added temperature and fan sensors panels and also small esthetic tweaks:
- Changed Overall average to a line every 1m, useful for alerts
- Changed Internet traffic bar from 1h to 5m
- Changed line thickness from 2 to 1
- Changed thresholds from 80 to 90
- Added temperature and fan sensors panels, useful for alerts as well
prometheus.yml
scrape_configs:
  - job_name: "prometheus"
    static_configs:
      - targets: ["host1:9100", "host2:9100", "host3:9100", "vm1:9100"]
prometheus.service (not required if using containers)
# /etc/systemd/system/prometheus.service
[Unit]
Description=Prometheus Server
Documentation=https://prometheus.io/docs/introduction/overview/
After=network-online.target
[Service]
User=root
Restart=on-failure
ExecStart=/usr/bin/prometheus –config.file=/etc/prometheus/prometheus.yml –web.listen-address=:9091
[Install]
WantedBy=multi-user.target
Data source config
Collector type:
Collector plugins:
Collector config:
Revisions
Upload an updated version of an exported dashboard.json file from Grafana
| Revision | Description | Created | |
|---|---|---|---|
| Download |
Metrics Endpoint (Prometheus)
Easily monitor any Prometheus-compatible and publicly accessible metrics URL with Grafana Cloud's out-of-the-box monitoring solution.
Learn more