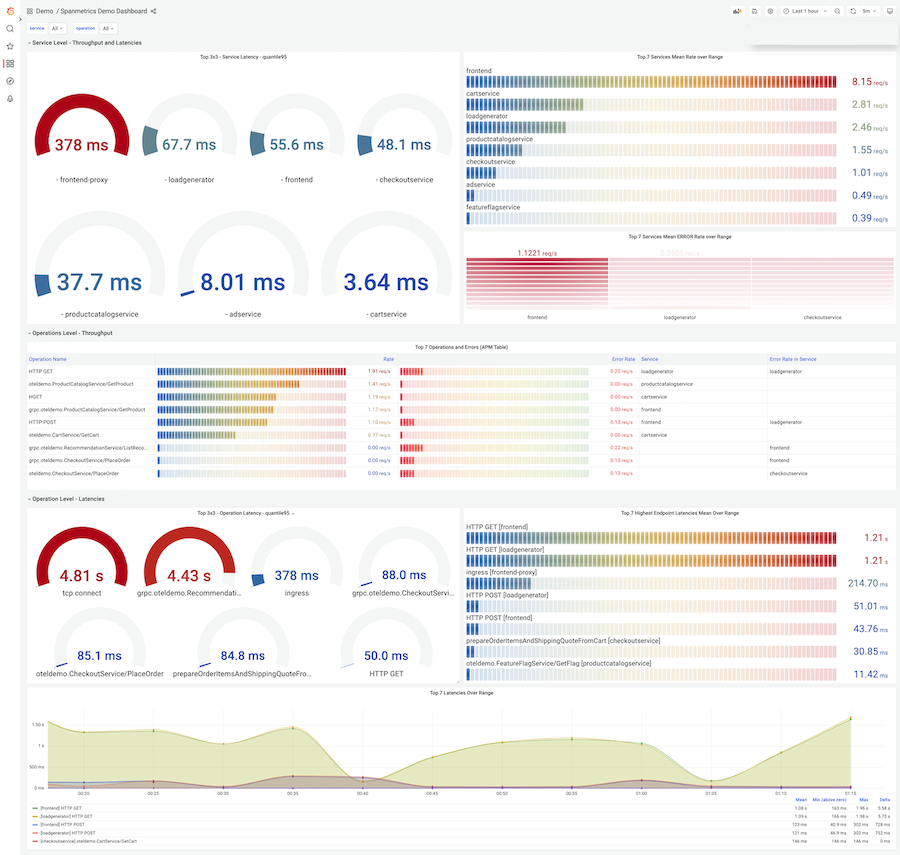
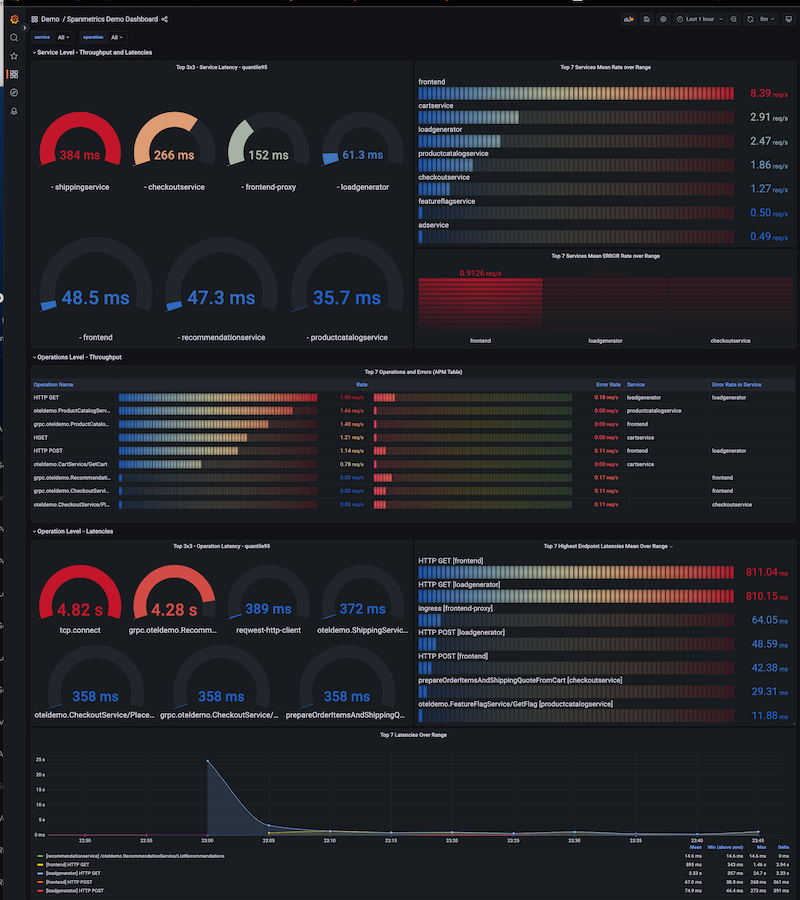
Spanmetrics Demo Dashboard
Spanmetrics way of application view.
Description
Spanmetrics sample dashboard from Openetelemetry Demo App 1.4 release.For any application deriving spanmetrics.
Why Spanmetrics?
OpenTelemetry SpanMetrics Processor is a popular choice for collecting metrics in a language-agnostic way. With the ability to automatically instrument code and collect metrics across a variety of programming languages, it offers ease of use and flexibility. Additionally, OpenTelemetry SpanMetrics Processor produces what is known as R.E.D. metrics, which stands for Rate, Errors, and Duration. This allows developers to quickly and easily monitor the performance of their applications in real-time, helping them to identify issues and improve the overall user experience. Overall, the combination of language-agnostic collection, auto-instrumentation, and R.E.D. metrics make OpenTelemetry SpanMetrics Processor a valuable tool for any developer looking to monitor the performance of their applications.
Notes
- Spanmetrics namespace differs in Grafana agent. You might need to append a namespace in front of metrics such as calls_total. eg. trace_spanmetrics_calls_total
Data source config
Collector config:
Upload an updated version of an exported dashboard.json file from Grafana
| Revision | Description | Created | |
|---|---|---|---|
| Download |