TDinsight for 3.x
Monitor TDengine
TDinsight - A Monitoring Solution For TDengine with Grafana
TDinsight v3.x is a solution for monitoring TDengine using the builtin native monitoring database and Grafana.
TDengine writes monitoring data into a special database through taosKeeper. The metrics may include the server's CPU, memory, hard disk space, network bandwidth, number of requests, disk read/write speed, slow queries, other information like important system operations (user login, database creation, database deletion, etc.), and error alarms. With Grafana and TDengine Data Source Plugin, TDinsight can visualize cluster status, node information, insertion and query requests, resource usage, vnode, dnode, and mnode status, exception alerts and many other metrics. This is very convenient for developers who want to monitor TDengine cluster status in real-time.
This article will guide users to install the Grafana server and TDengine Data Source Plugin, and deploy the TDinsight v3.x.
Requirements
- a single-node TDengine server or a multi-node TDengine cluster and a Grafana server are required. This dashboard requires TDengine 3.0.1.0 and above, with the monitoring feature enabled. For detailed configuration, please refer to TDengine monitoring configuration.
- taosAdapter has been instaleld and running, please refer to taosAdapter.
- taosKeeper has been installed and running, please refer to taosKeeper.
Install Grafana
We recommend using the latest Grafana version 8 or 9. You can install Grafana on any supported operating system by following the official Grafana documentation Instructions to install Grafana.
Installing Grafana on Debian or Ubuntu
For Debian or Ubuntu operating systems, we recommend the Grafana image repository and using the following command to install from scratch.
sudo apt-get install -y apt-transport-https
sudo apt-get install -y software-properties-common wget
wget -q -O - https://packages.grafana.com/gpg.key |\
  sudo apt-key add -
echo "deb https://packages.grafana.com/oss/deb stable main" |\
  sudo tee -a /etc/apt/sources.list.d/grafana.list
sudo apt-get update
sudo apt-get install grafana
Install Grafana on CentOS / RHEL
You can install it from its official YUM repository.
sudo tee /etc/yum.repos.d/grafana.repo << EOF
[grafana]
name=grafana
baseurl=https://packages.grafana.com/oss/rpm
repo_gpgcheck=1
enabled=1
gpgcheck=1
gpgkey=https://packages.grafana.com/gpg.key
sslverify=1
sslcacert=/etc/pki/tls/certs/ca-bundle.crt
EOF
sudo yum install grafana
Or install it with RPM package.
wget https://dl.grafana.com/oss/release/grafana-7.5.11-1.x86_64.rpm
sudo yum install grafana-7.5.11-1.x86_64.rpm
# or
sudo yum install \
  https://dl.grafana.com/oss/release/grafana-7.5.11-1.x86_64.rpm
set up TDinsight v3.x
Install the TDengine data source plugin
Install the latest version of the TDengine Data Source plugin from GitHub
get_latest_release() {
  curl --silent "https://api.github.com/repos/taosdata/grafanaplugin/releases/latest" |
    grep '"tag_name":' |
    sed -E 's/.*"v([^"]+)".*/\1/'
}
TDENGINE_PLUGIN_VERSION=$(get_latest_release)
sudo grafana-cli \
  --pluginUrl https://github.com/taosdata/grafanaplugin/releases/download/v$TDENGINE_PLUGIN_VERSION/tdengine-datasource-$TDENGINE_PLUGIN_VERSION.zip \
  plugins install tdengine-datasource
NOTE: The 3.1.6 and earlier version plugins require the following setting in the configuration
file /etc/grafana/grafana.ini to enable unsigned plugins.
[plugins]
allow_loading_unsigned_plugins = tdengine-datasource
Install TDengine Data Source plugin from Grafana Plugins page
Point to the Configurations -> Plugins(or "/plugins" url), and search "TDengine".
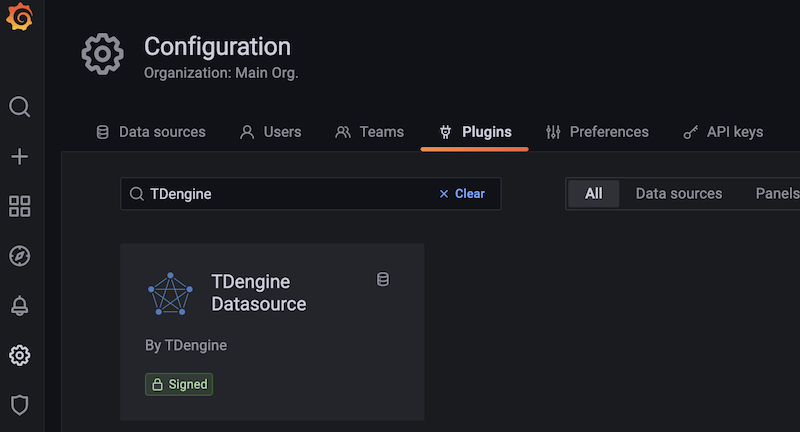
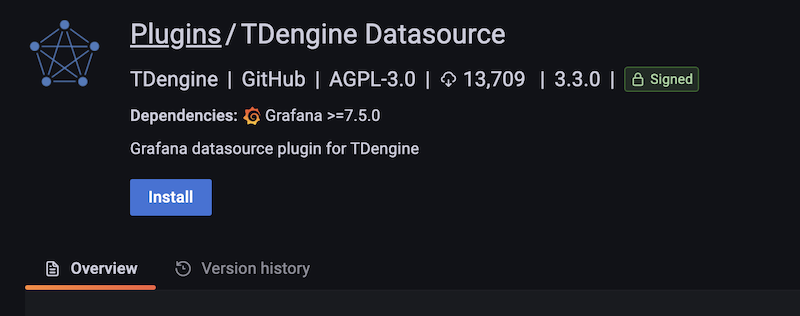
Click "TDengine Datasource", and click "install".
Start the Grafana service
sudo systemctl start grafana-server
sudo systemctl enable grafana-server
Logging into Grafana
Open the default Grafana URL in a web browser: http://localhost:3000. The default username/password is admin.
Grafana will require a password change after the first login.
Adding a TDengine Data Source
Point to the Configurations -> Data Sources menu, and click the Add data source button.

Search for and select TDengine.

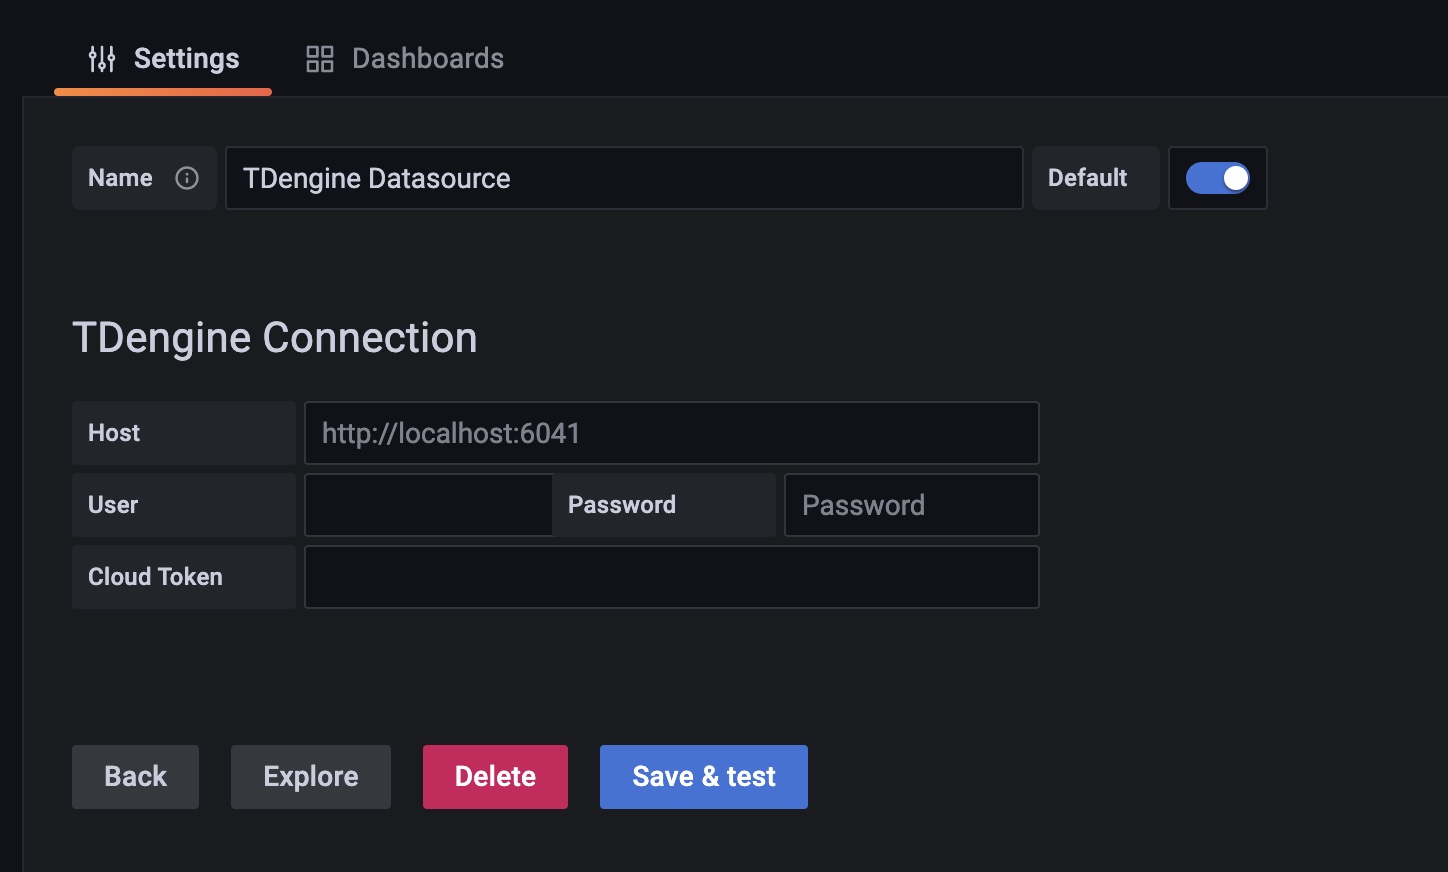
Configure the TDengine datasource.

Save and test. It will report 'TDengine Data source is working' in normal circumstances.

Importing dashboard
Importing dashboard from datasource confining page.
Click Dashboard tab in TDengine datasource confining page.

Click the "import" button of "TDinsight for 3.x", and import the dashboard.
Import dashboard from importing page
Point to + / Create - import (or /dashboard/import url).

Input dashboard id 18180 in Import via grafana.com and click Load.

After importing, TDinsight v3.x dashboard as follows.

TDinsight v3.x Dashboard details
The TDinsight dashboard is designed to provide the usage and status of TDengine-related resources, e.g. dnodes, mnodes, vnodes and databases.
The details of the metrics are as follows.
Cluster Status
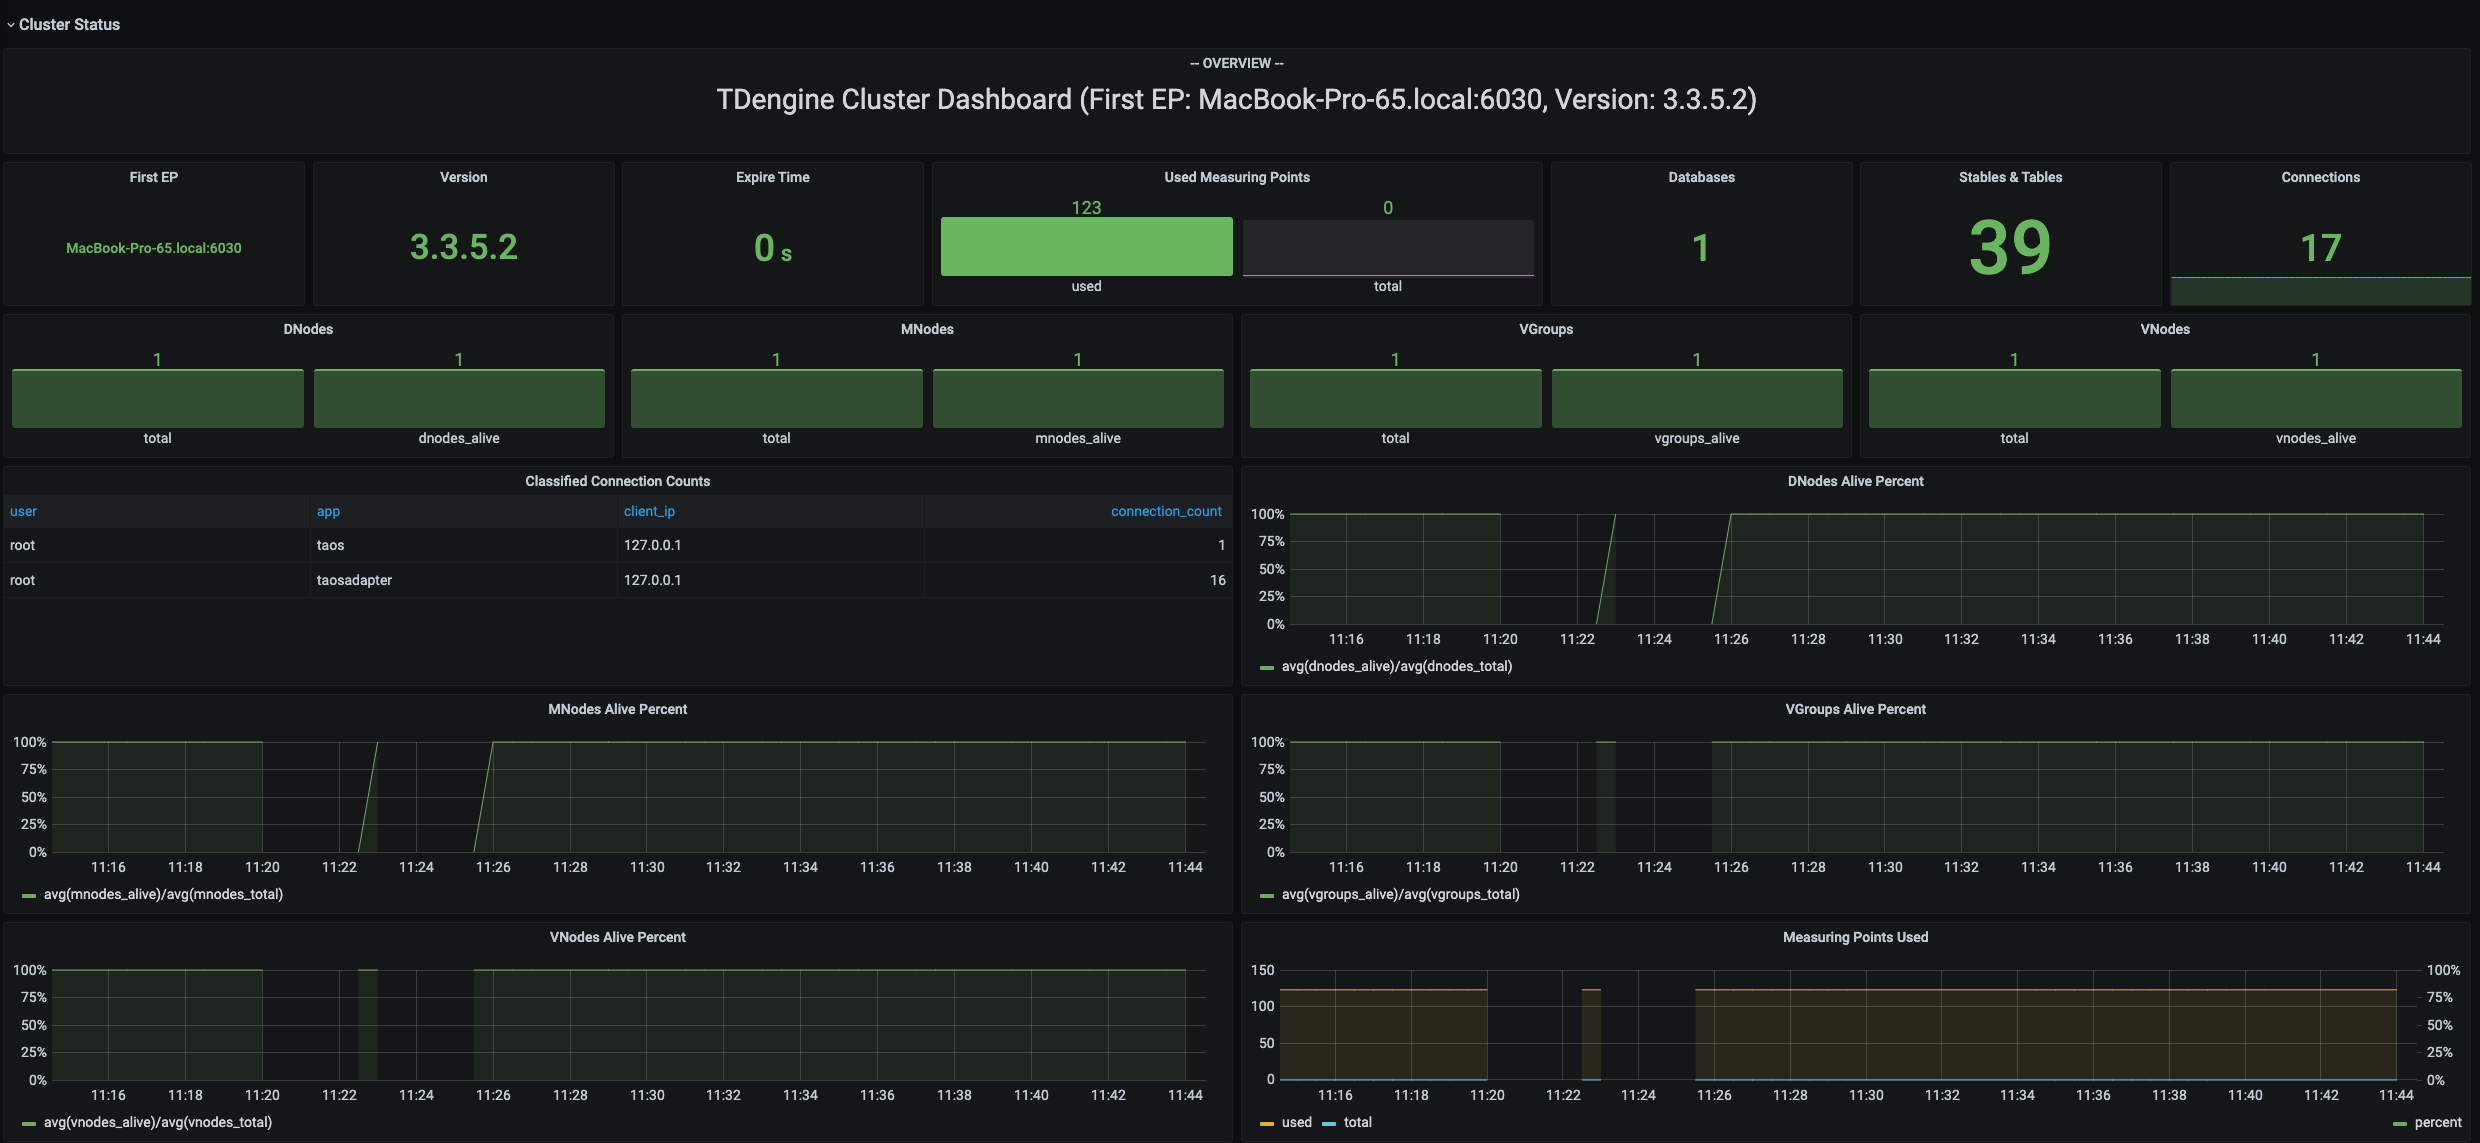
This section contains the current information and status of the cluster (from left to right, top to bottom).
- First EP: the firstEp setting in the current TDengine cluster.
- Version: TDengine server version (leader mnode).
- Master Uptime: The time elapsed since the current Leader MNode was elected as Leader.
- Expire Time: Enterprise version expiration time.
- Used Measuring Points: The number of measuring points used by the Enterprise Edition.
- Databases: The number of databases.
- Tables: The number of table.
- Connections: The number of current connections.
- DNodes/MNodes/VGroups/VNodes: Total number of each resource and the number of survivors.
- Classified Connection Counts: The current number of active connections, classified by user, application, and IP.
- DNodes/MNodes/VGroups/VNodes Alive Percent: The ratio of the number of alive/total for each resource.
- Measuring Points Used: The number of measuring points(no data available in the community version, healthy by default).
- Grants Expire Time: the expiration time of the enterprise version (no data available for the community version, healthy by default).
- Error Rate: Aggregate error rate (average number of errors per second) for alert-enabled clusters.
DNodes Status
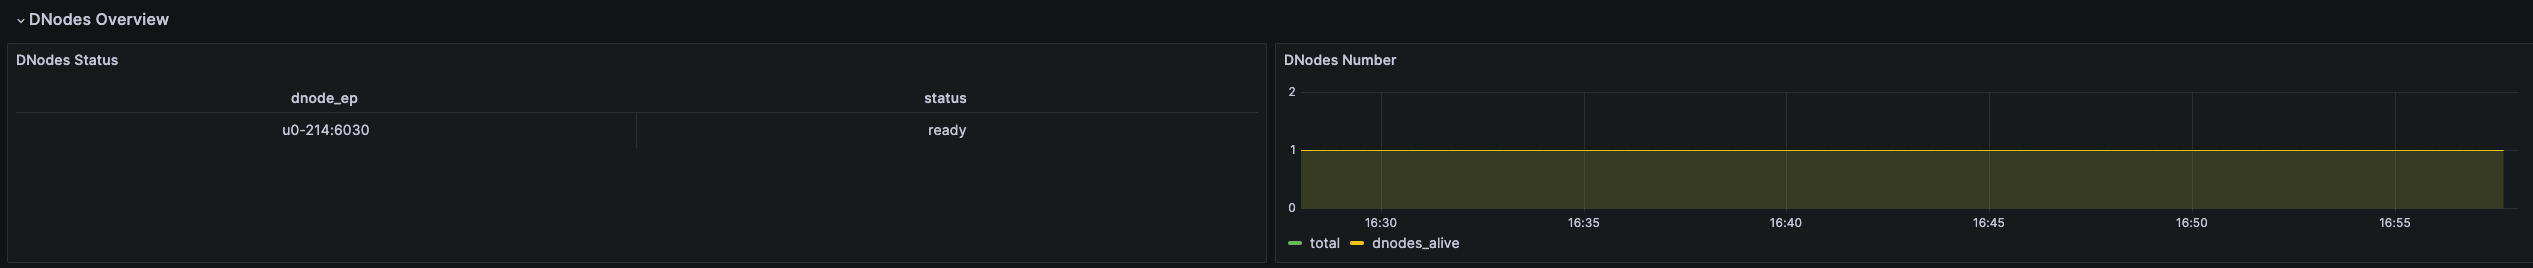
- DNodes Status: simple table view of
show dnodes. - DNodes Lifetime: the time elapsed since the dnode was created.
- DNodes Number: the trends in the number of DNodes.
MNode Overview
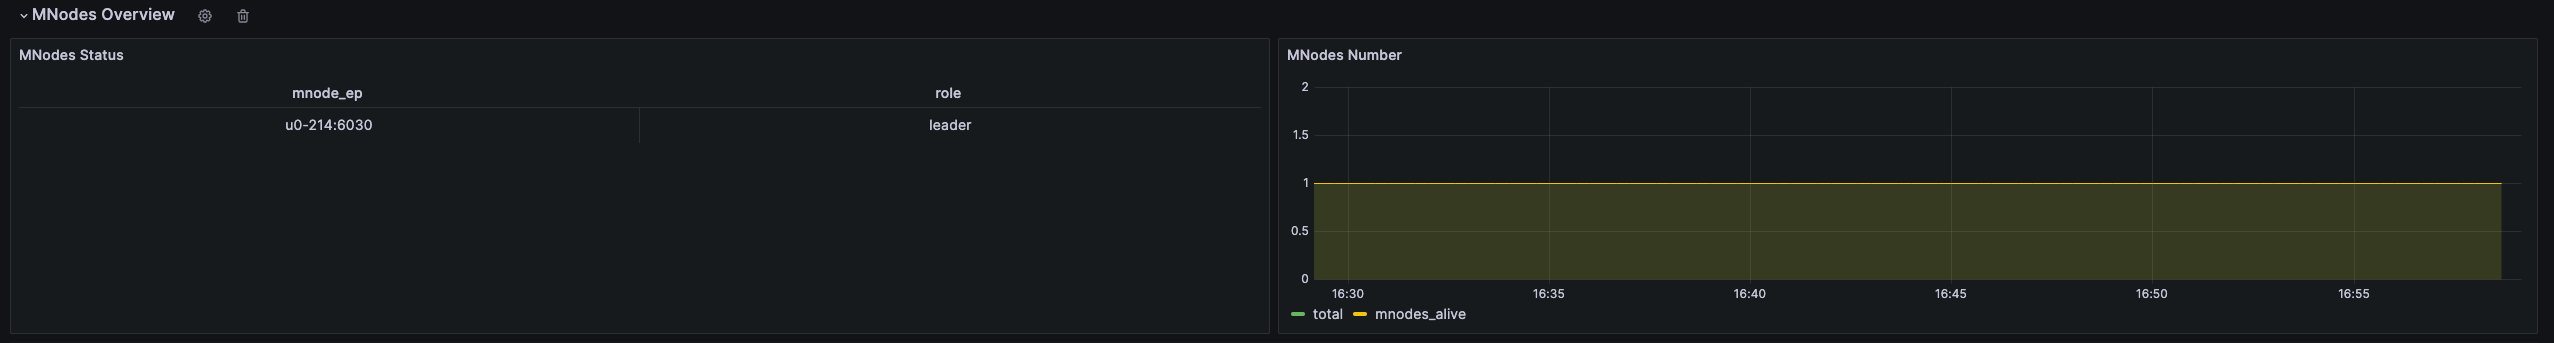
- MNodes Status: a simple table view of
show mnodes. - MNodes Number: similar to
DNodes Number, the trends in the number of MNodes.
Request
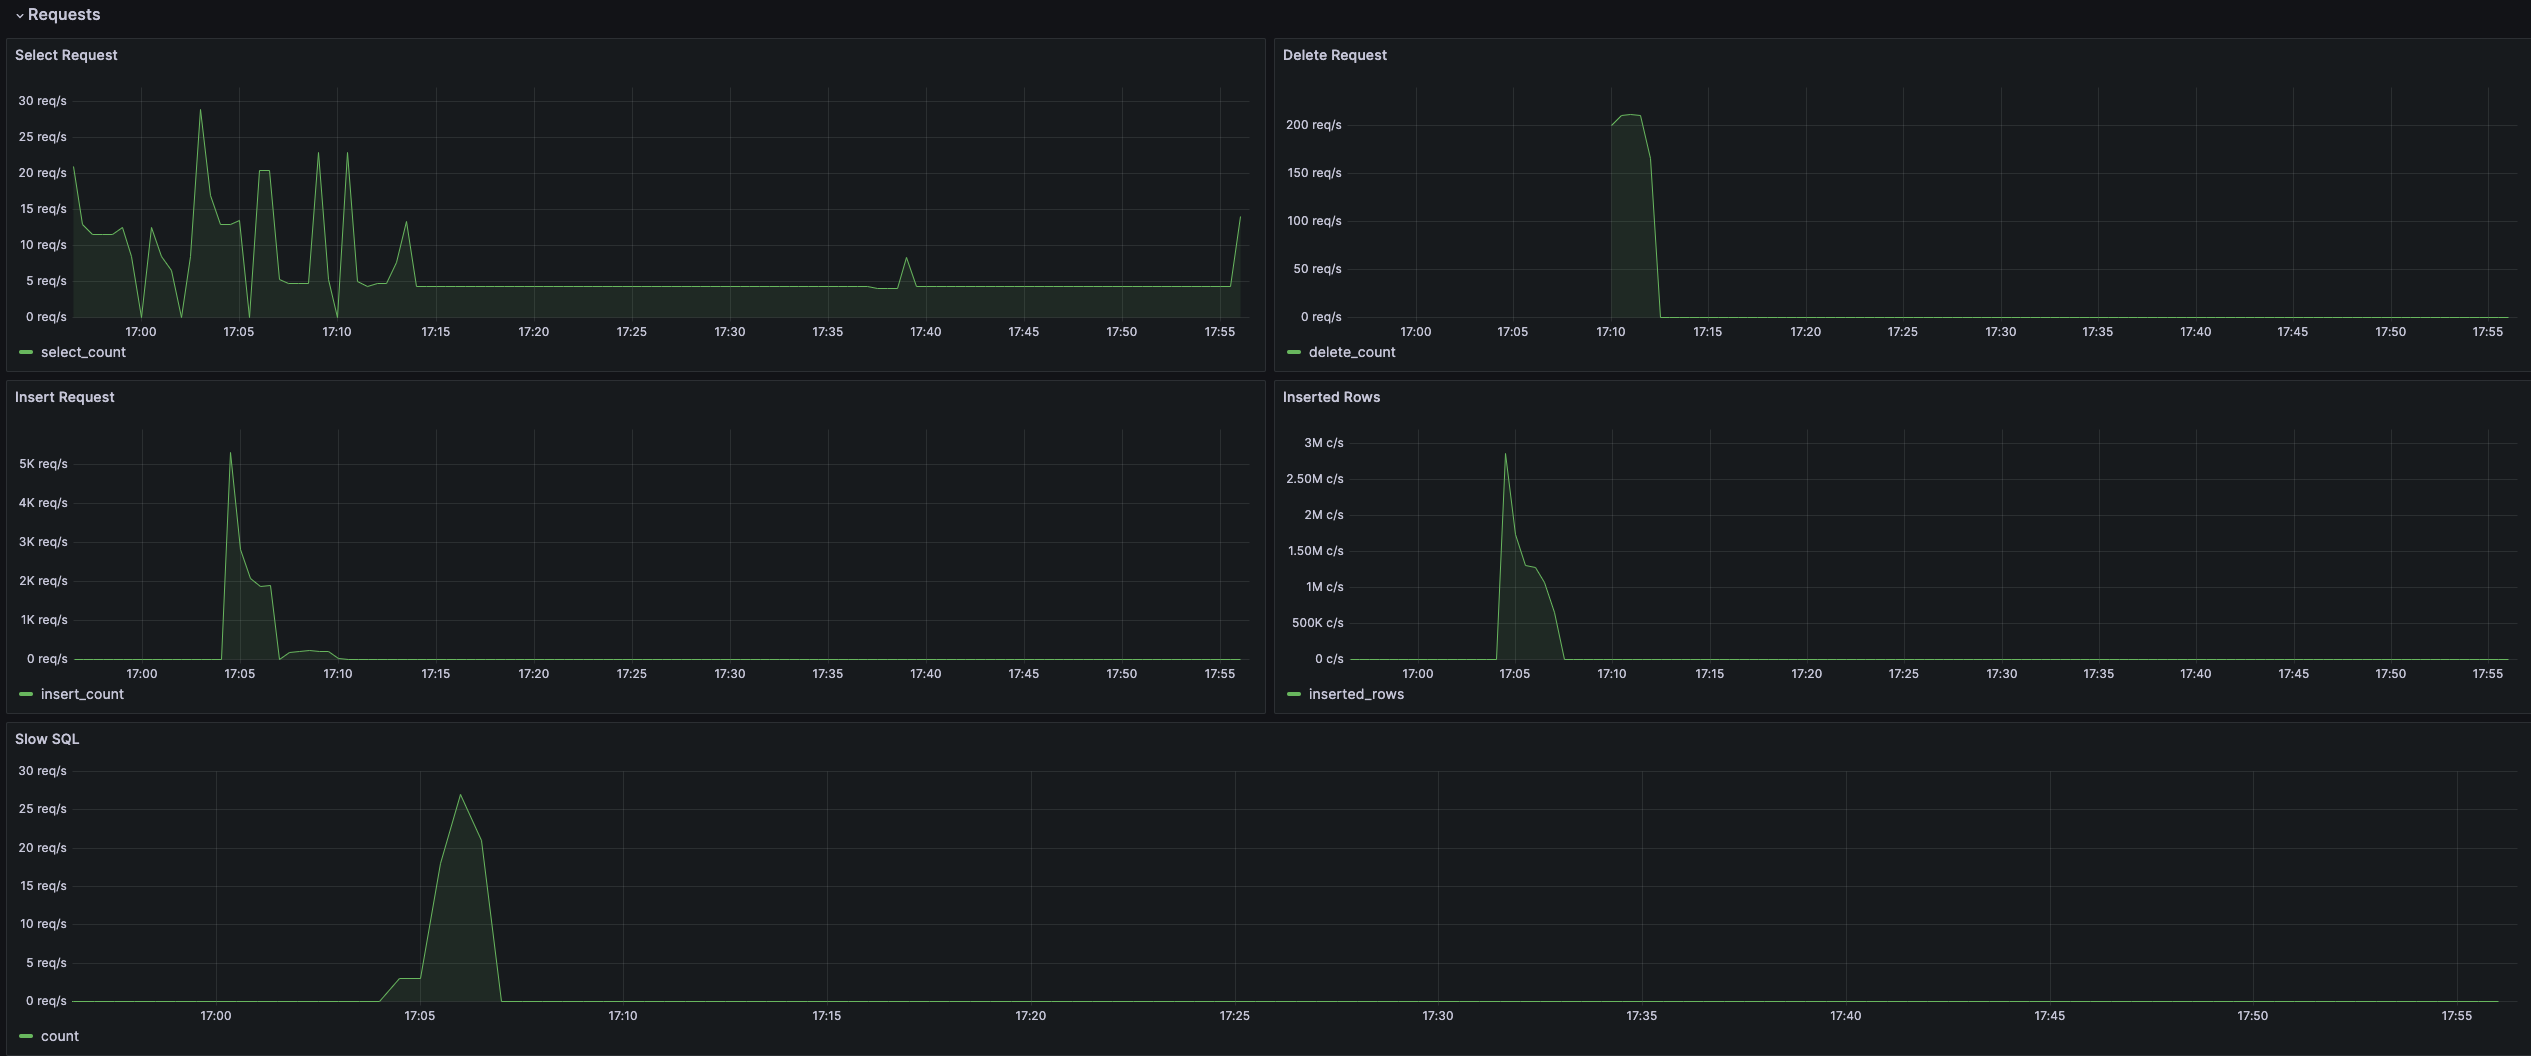
- Requests Rate(Inserts per Second): average number of inserts per second.
- Requests (Selects): number of query requests and rate of change (count of second).
Database
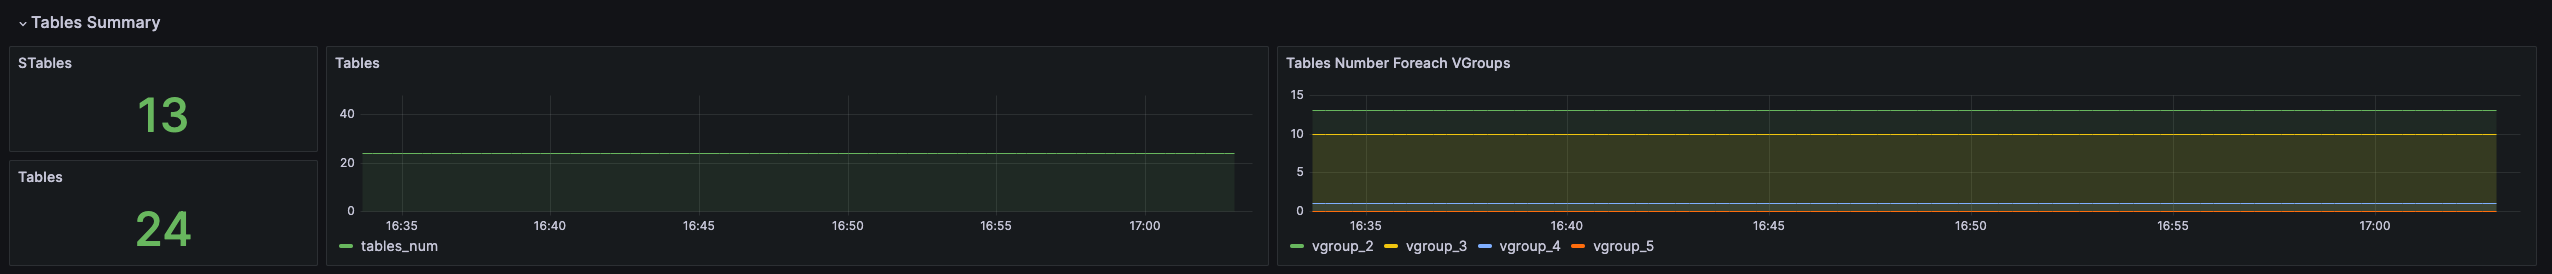
Database usage, repeated for each value of the variable $database, one rows per database.
- STables: number of super tables.
- Total Tables: number of all tables.
- Tables: number of normal tables.
- Tables Number Foreach VGroups: number of tables per vgroup.
DNode Resource Usage
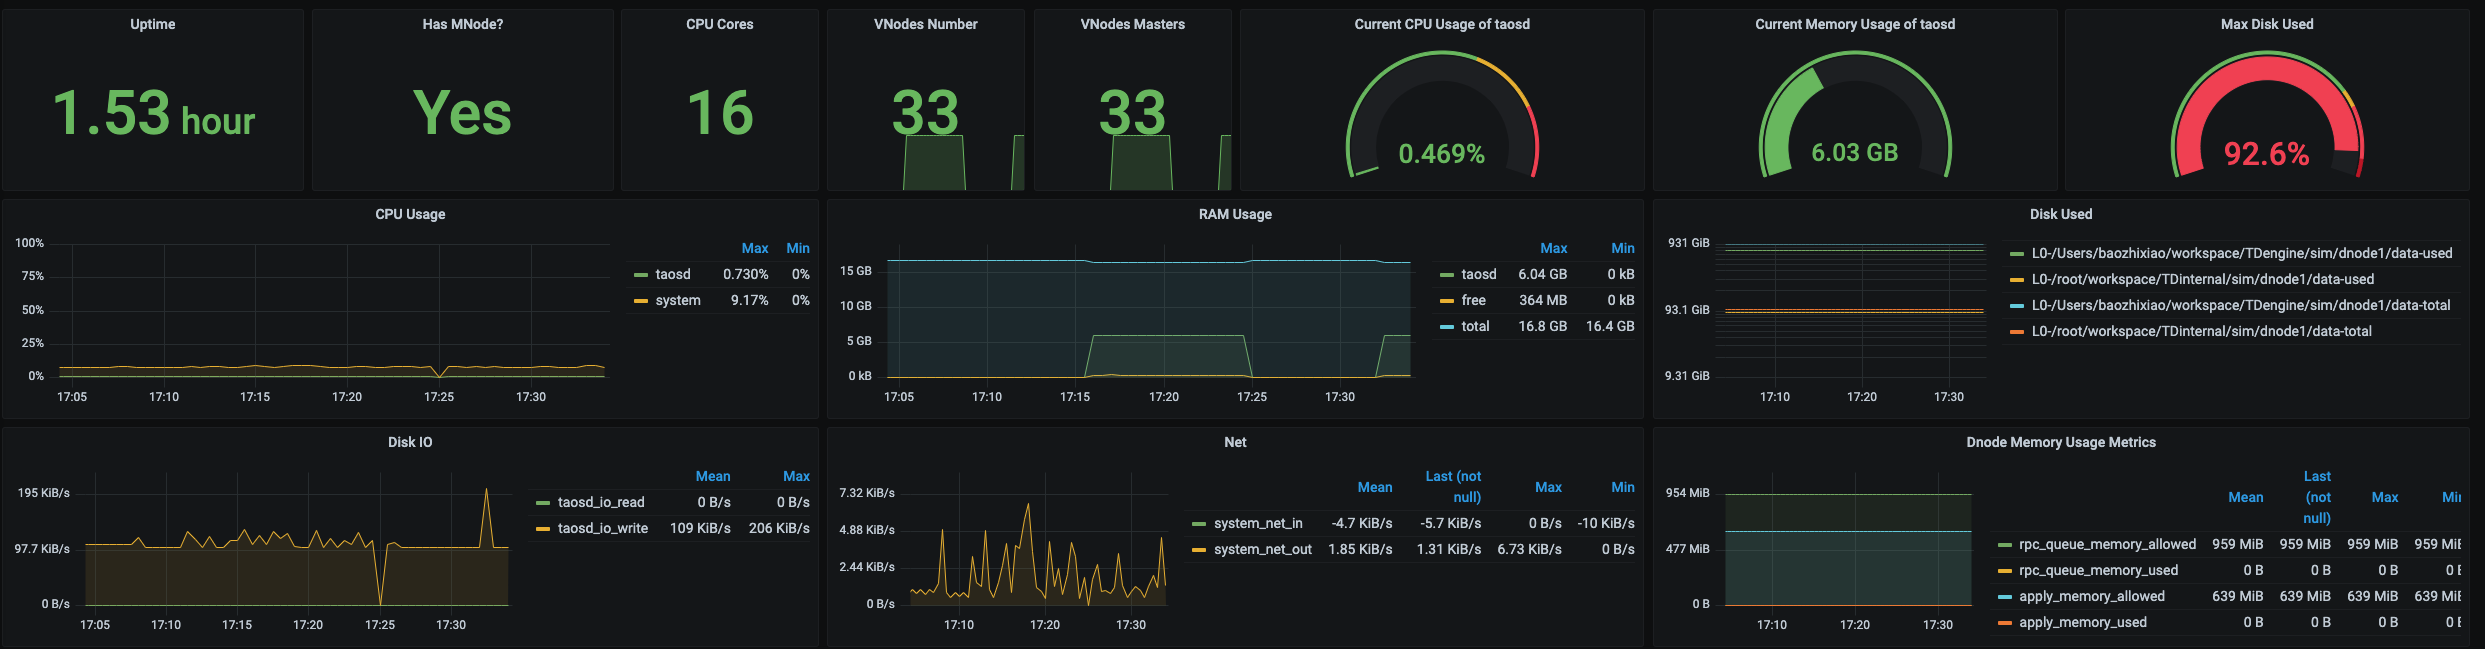
数据节点资源使用情况展示, 对变量 $fqdn 即每个数据节点进行重复多行展示.包括:
Data node resource usage display with repeated multiple rows for the variable $fqdn, one rows per dnode.
- Uptime: the time elapsed since the dnode was created.
- Has MNodes?: whether the current dnode is a mnode.
- CPU Cores: the number of CPU cores.
- VNodes Number: the number of VNodes in the current dnode.
- VNodes Masters: the number of vnodes in the leader role.
- Current CPU Usage of taosd: CPU usage rate of taosd processes.
- Current Memory Usage of taosd: memory usage of taosd processes.
- Disk Used: The total disk usage percentage of the taosd data directory.
- CPU Usage: Process and system CPU usage.
- RAM Usage: Time series view of RAM usage metrics.
- Disk Used: Disks used at each level of multi-level storage (default is level0).
- Disk IO: Disk IO rate.
- Net IO: Network IO, the aggregate network IO rate in addition to the local network.
Login History
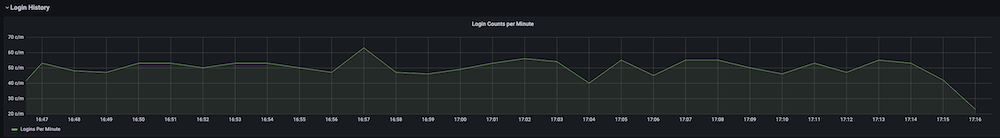
Currently, only the number of logins per minute is reported.
taosAdapter
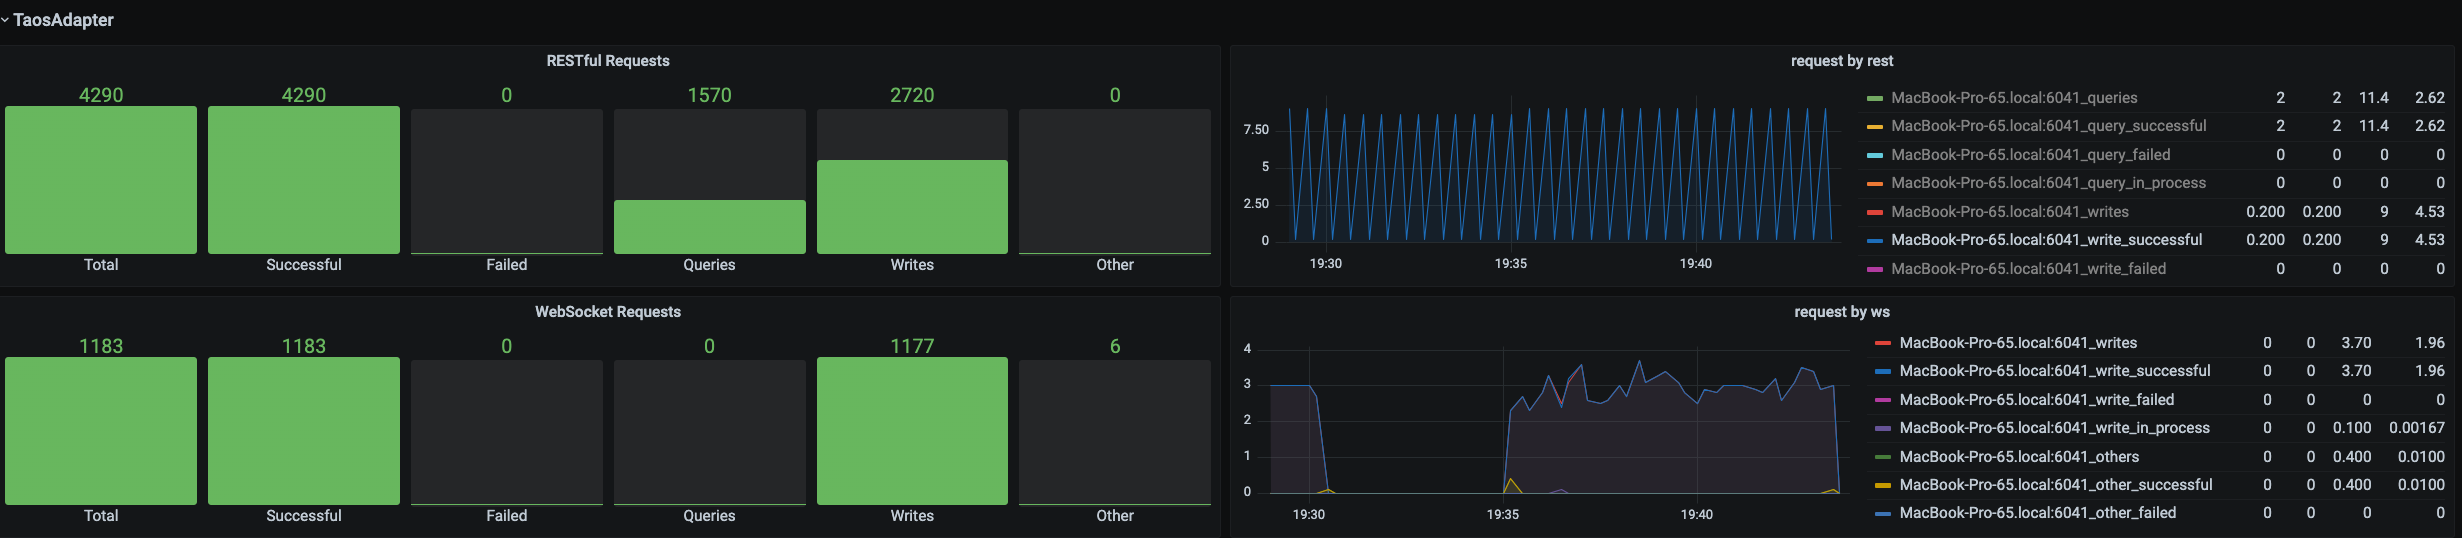
Support monitoring taosAdapter rest and websocket request statistics. Including:
- Total: number of total requests.
- Successful: number of total successful requests.
- Failed: number of total failed requests.
- Queries: number of total queries.
- Writes: number of total inserts or updates.
- Other: number of total other requests.
There is also line charts for detail dimensions.
Upgrade
You can update TDengine Grafana datasource plugin and TDinsight for 3.x by re-installation.
Uninstall
To completely uninstall TDinsight during a manual installation, you need to clean up the following.
- the TDinsight v3.x Dashboard in Grafana.
- the Data Source in Grafana.
- the
tdengine-datasourceplugin in Grafana.
Data source config
Collector config:
Upload an updated version of an exported dashboard.json file from Grafana
| Revision | Description | Created | |
|---|---|---|---|
| Download |