Redpanda Default Dashboard
This is the default dashboard for Redpanda. There are many charts on this page, so instead of listing each one here are the sections:
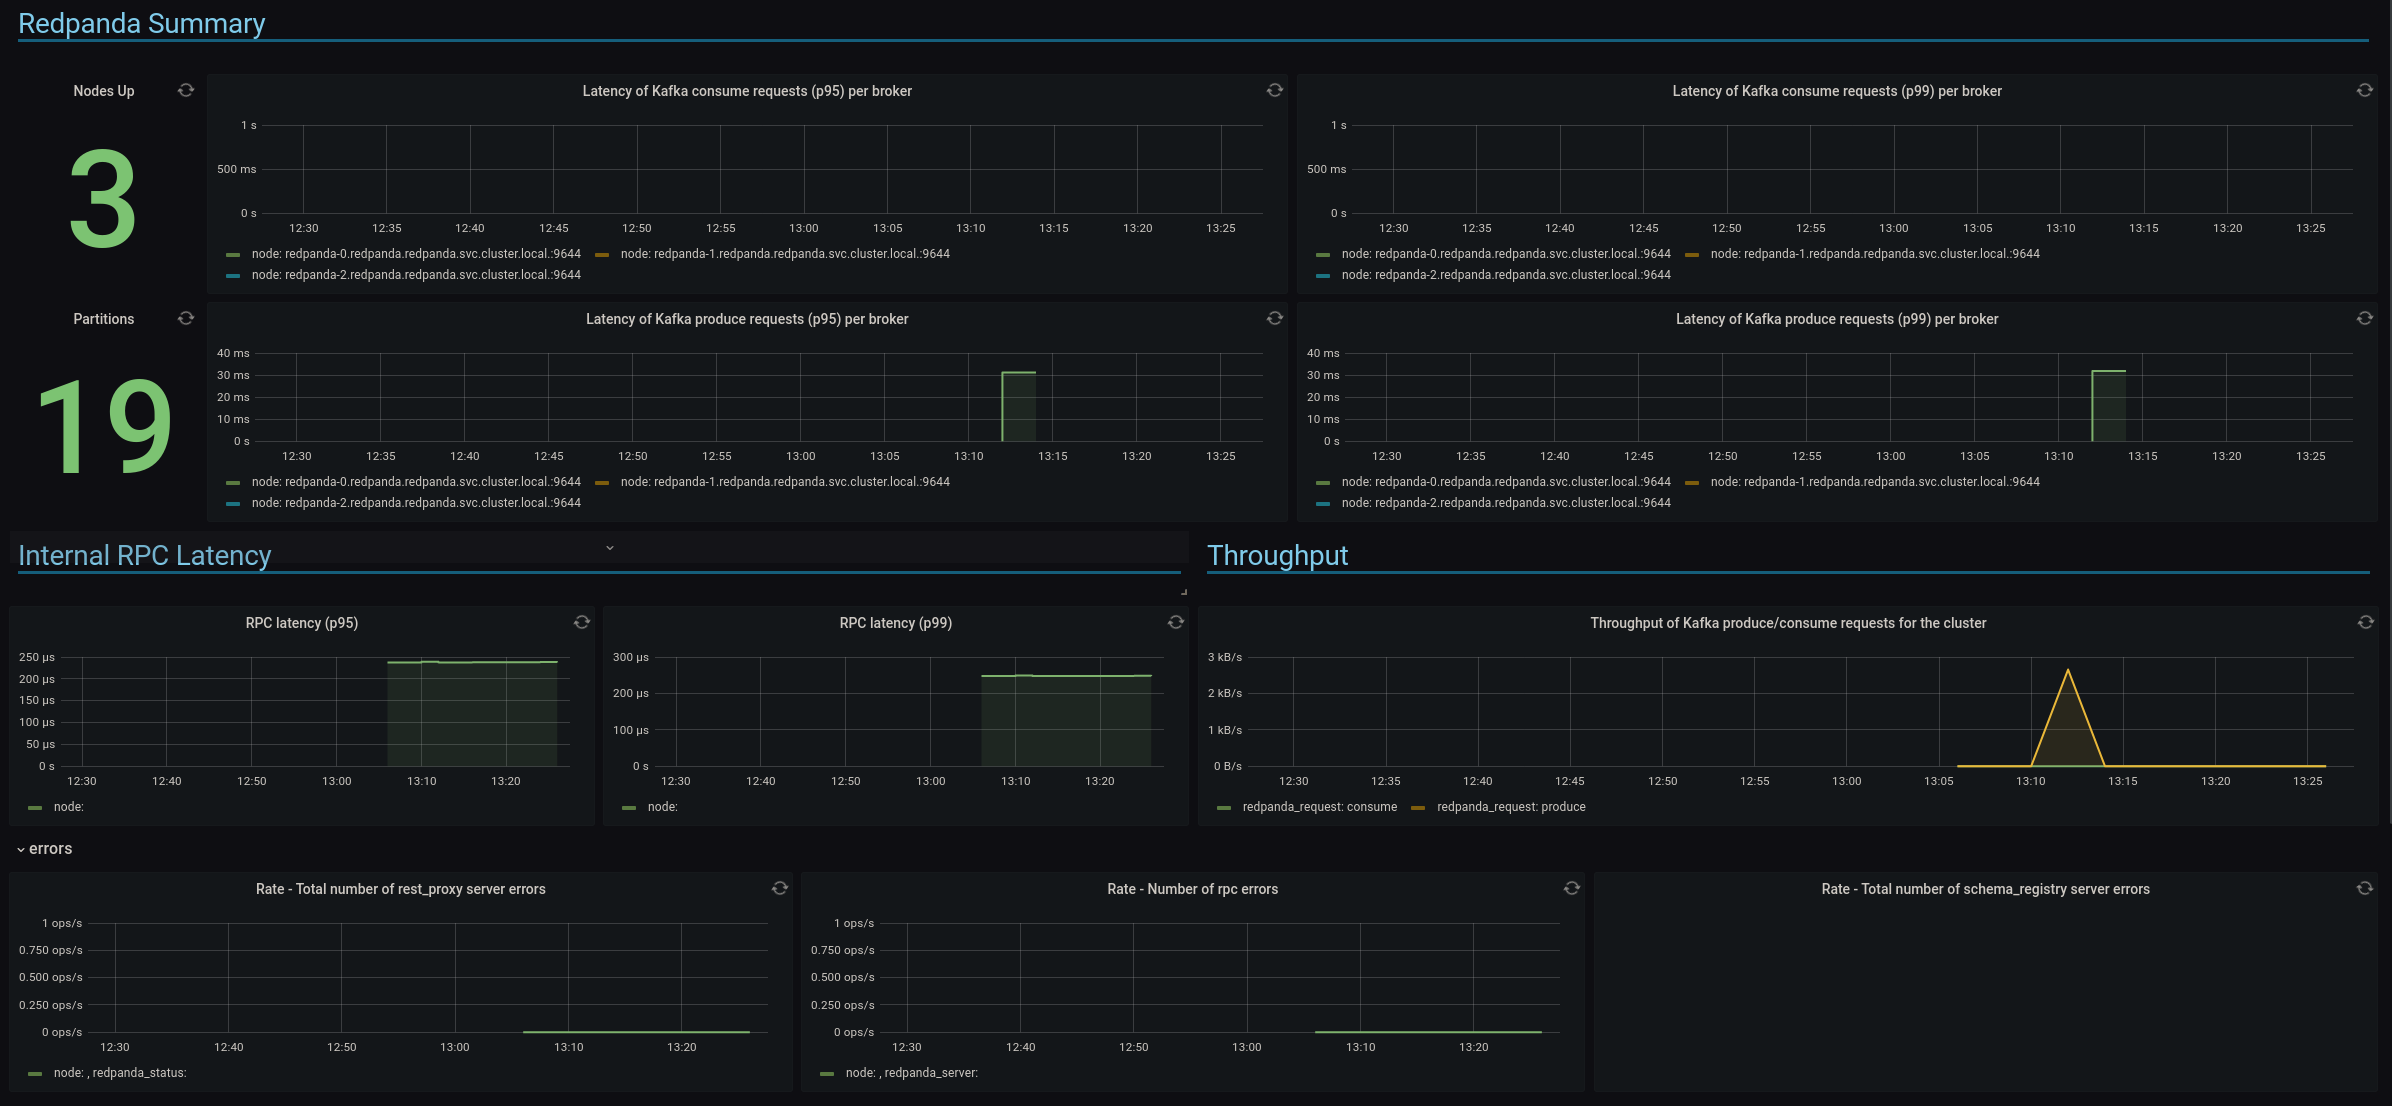
- Redpanda summary
- internal RPC latency
- throughput
- errors
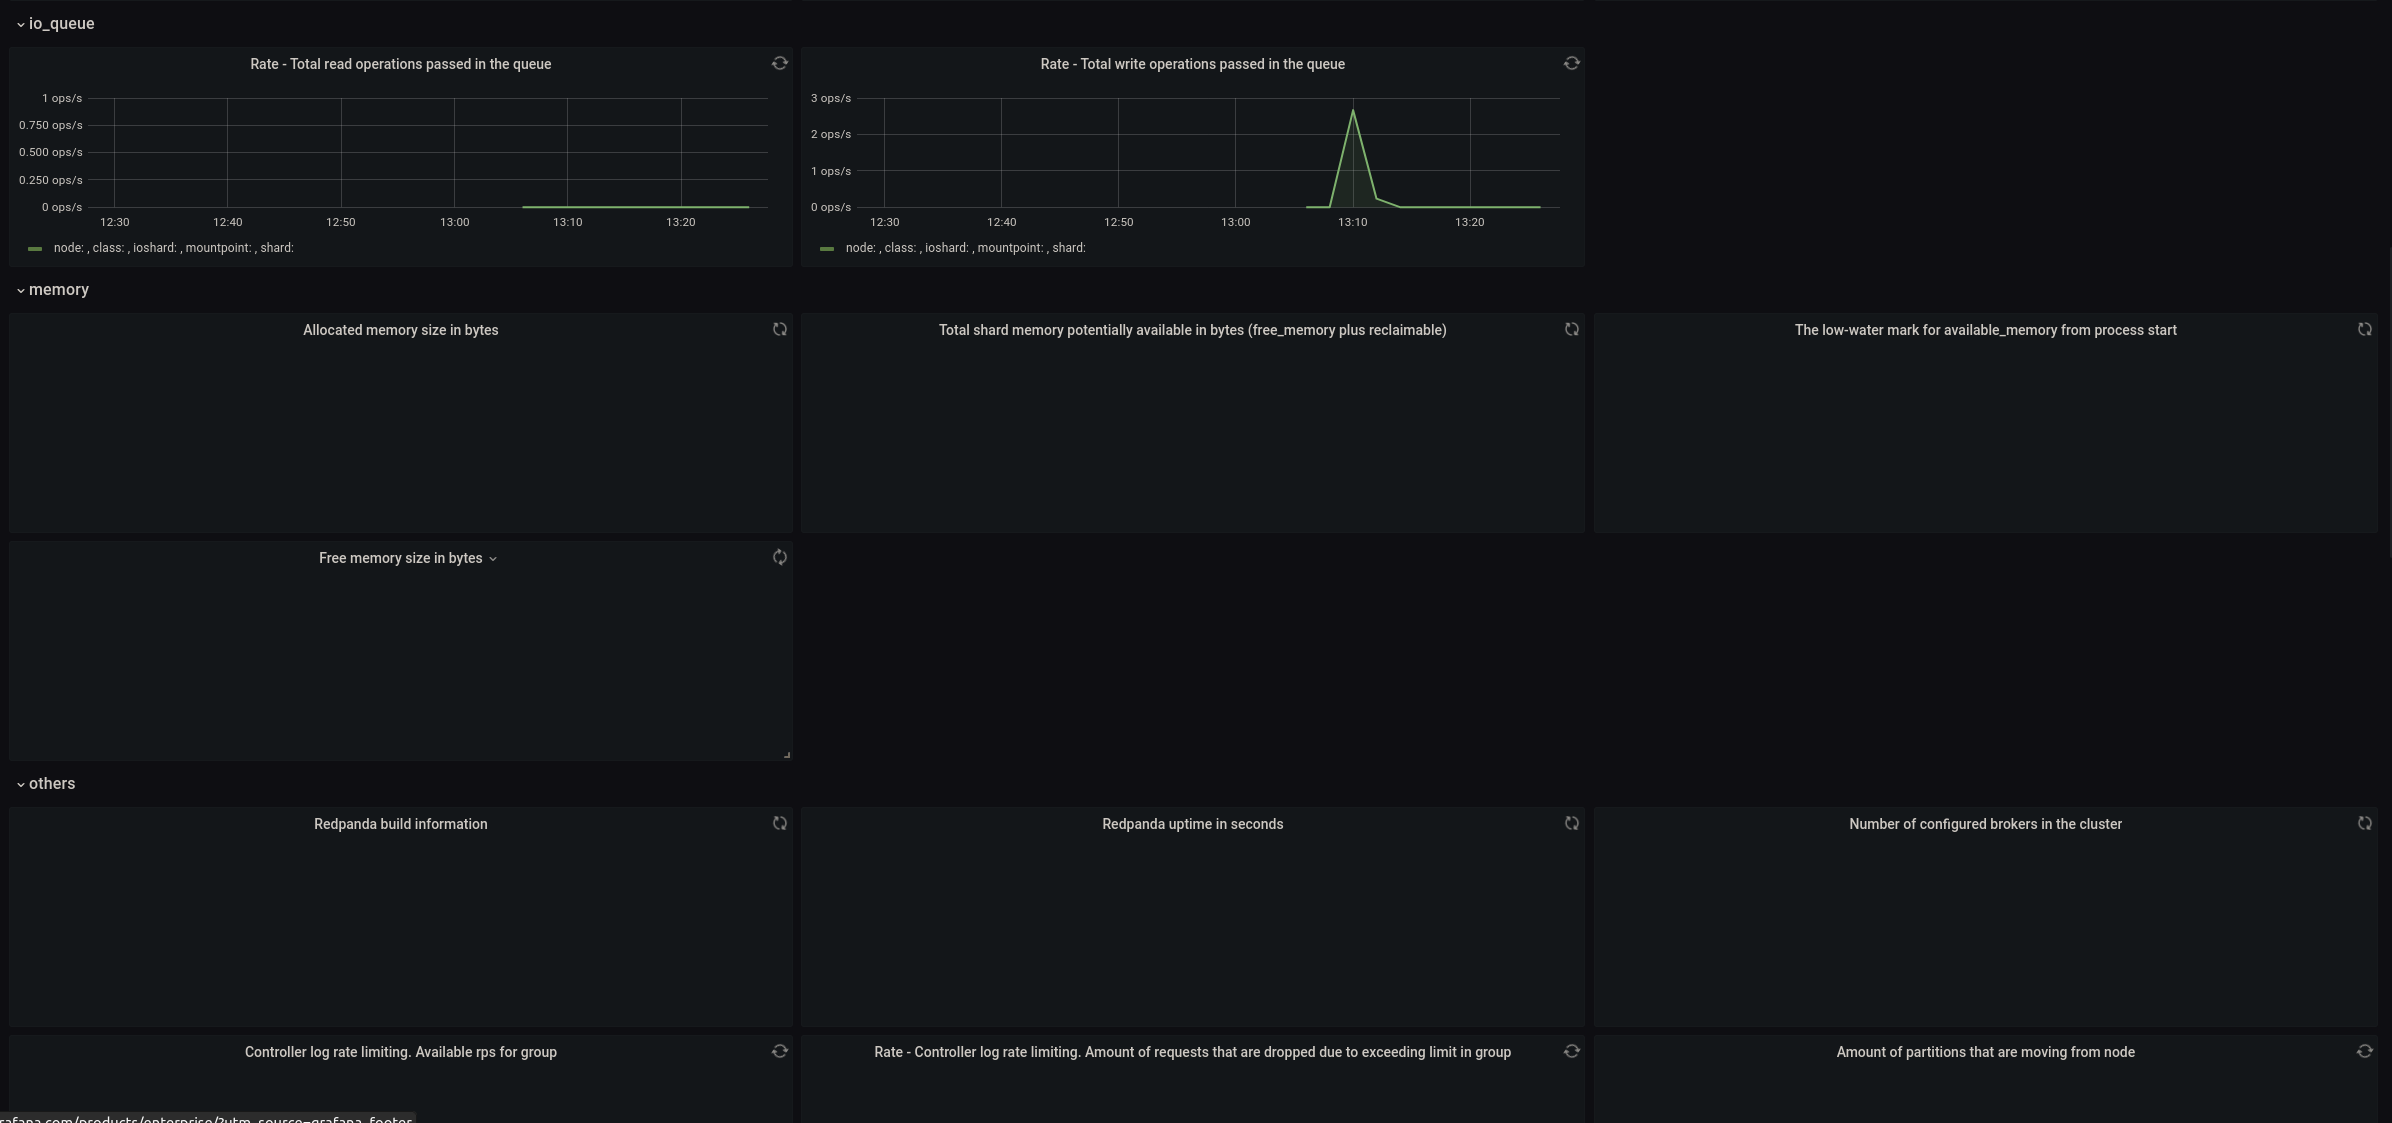
- IO queue
- memory
- others (build info, uptime, number of configured brokers, etc.)
- raft
- scheduler
- storage
Data source config
Collector type:
Collector plugins:
Collector config:
Revisions
Upload an updated version of an exported dashboard.json file from Grafana
| Revision | Description | Created | |
|---|---|---|---|
| Download |