Redpanda Kafka Java Consumer
Kafka Consumer Java client metrics
This dashboard requires a JMX agent reporting statistics from a Kafka Java consumer into Prometheus.
⚠️ This dashboard has some sample thresholds, this example is not meant to fit all use cases nor is it meant for production. Think of it as a learning tool to help you become comfortable with the metrics and thresholding.
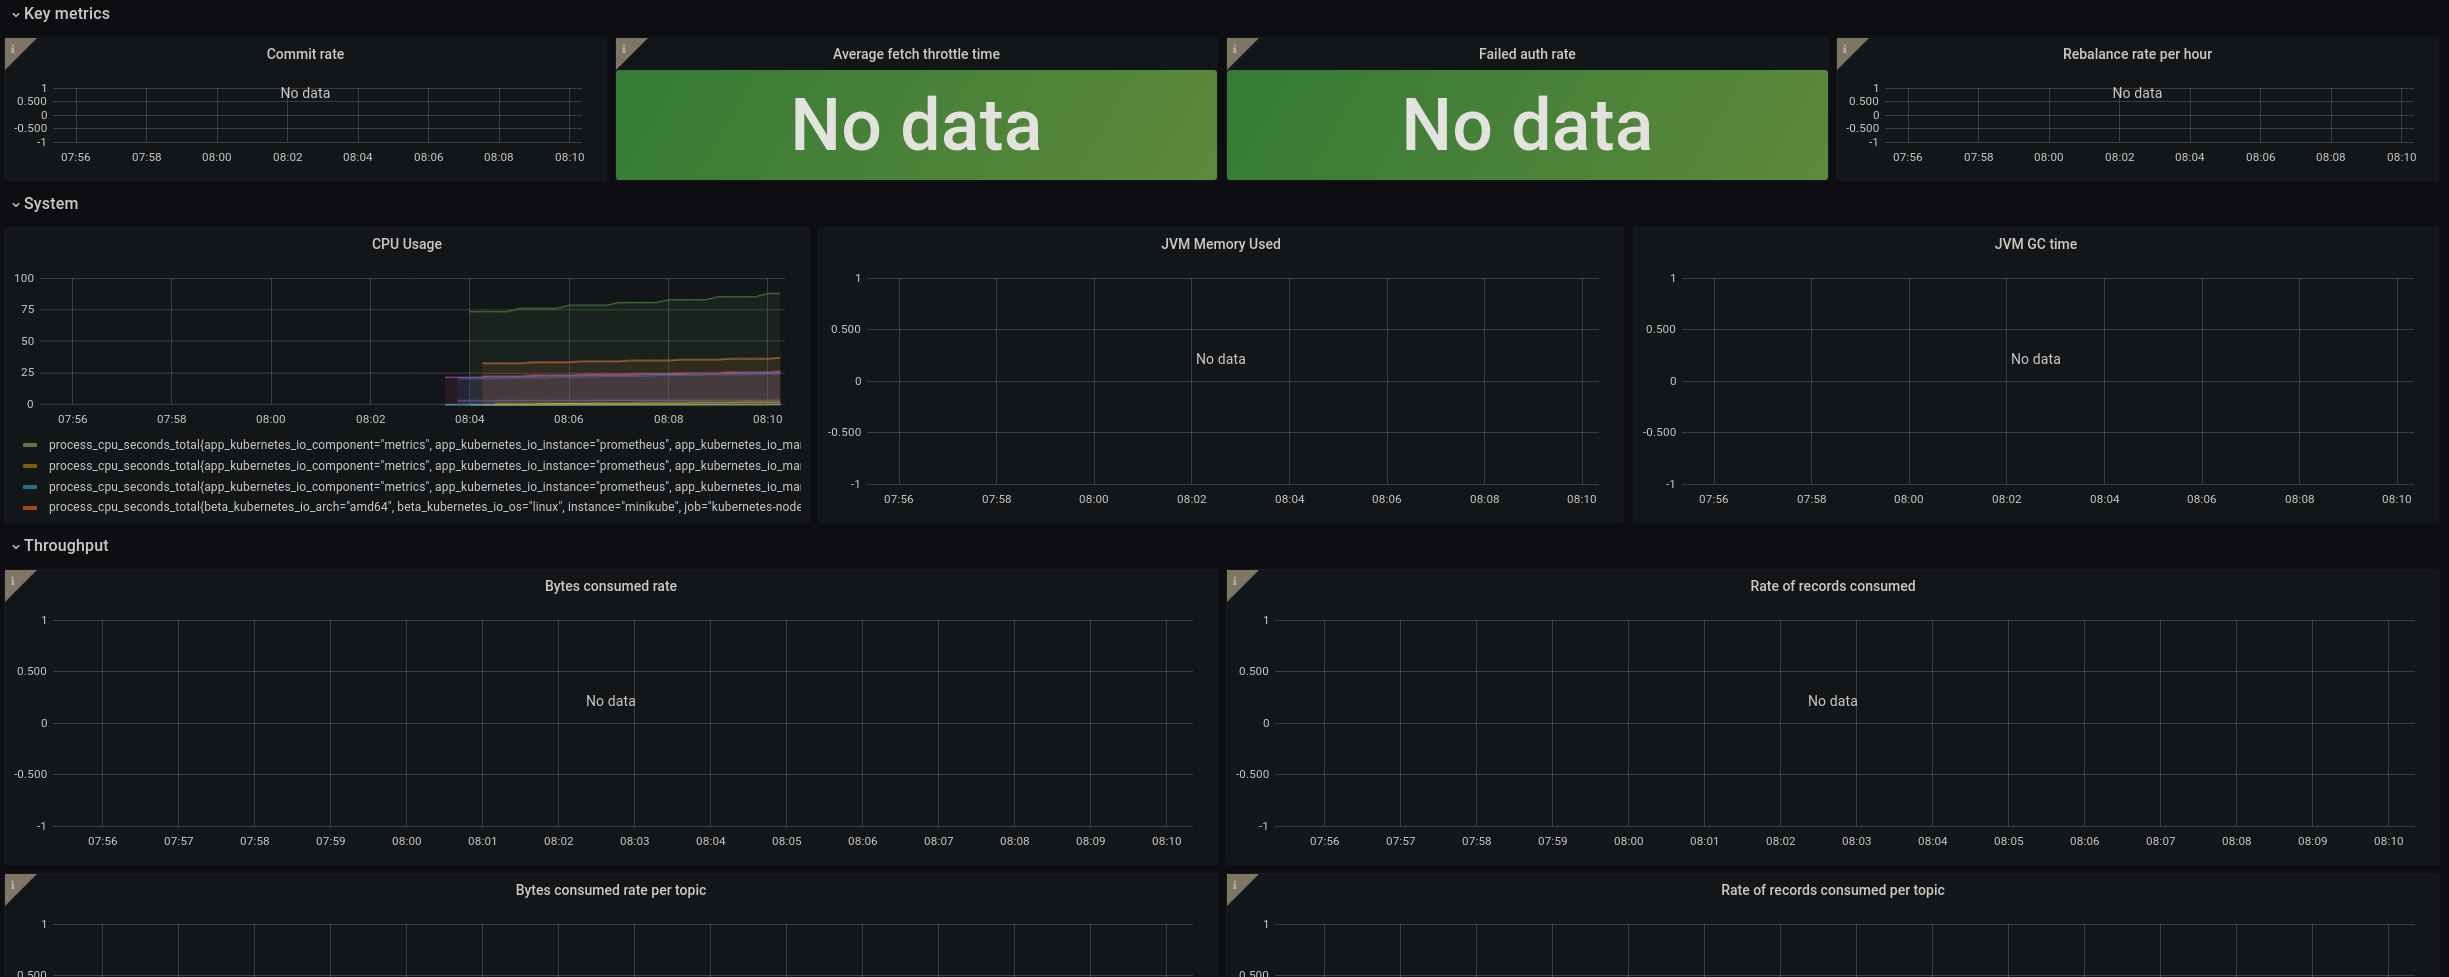
This dashboard focuses on consumers, and it has the following charts:
- commit rate
- average fetch throttle time
- failed auth rate
- rebalance rate per hour
- CPU usage
- JVM memory used
- JVM GC time
- bytes consumed rate
- rate of records consumed
- bytes consumed rate per topic
- rate of records consumed per topic
- fetch request rate
- fetch size average
- fetch latency average
- commit latency average
- commit rate
- current connection count
- node response rate
Data source config
Collector type:
Collector plugins:
Collector config:
Revisions
Upload an updated version of an exported dashboard.json file from Grafana
| Revision | Description | Created | |
|---|---|---|---|
| Download |
Java Virtual Machine (JVM)
Easily monitor a Java virtual machine, which allows computers to run Java programs, with Grafana Cloud's out-of-the-box monitoring solution.
Learn more