Grafana Analysis
An analysis of the Grafana repository over the last 10 yrs.
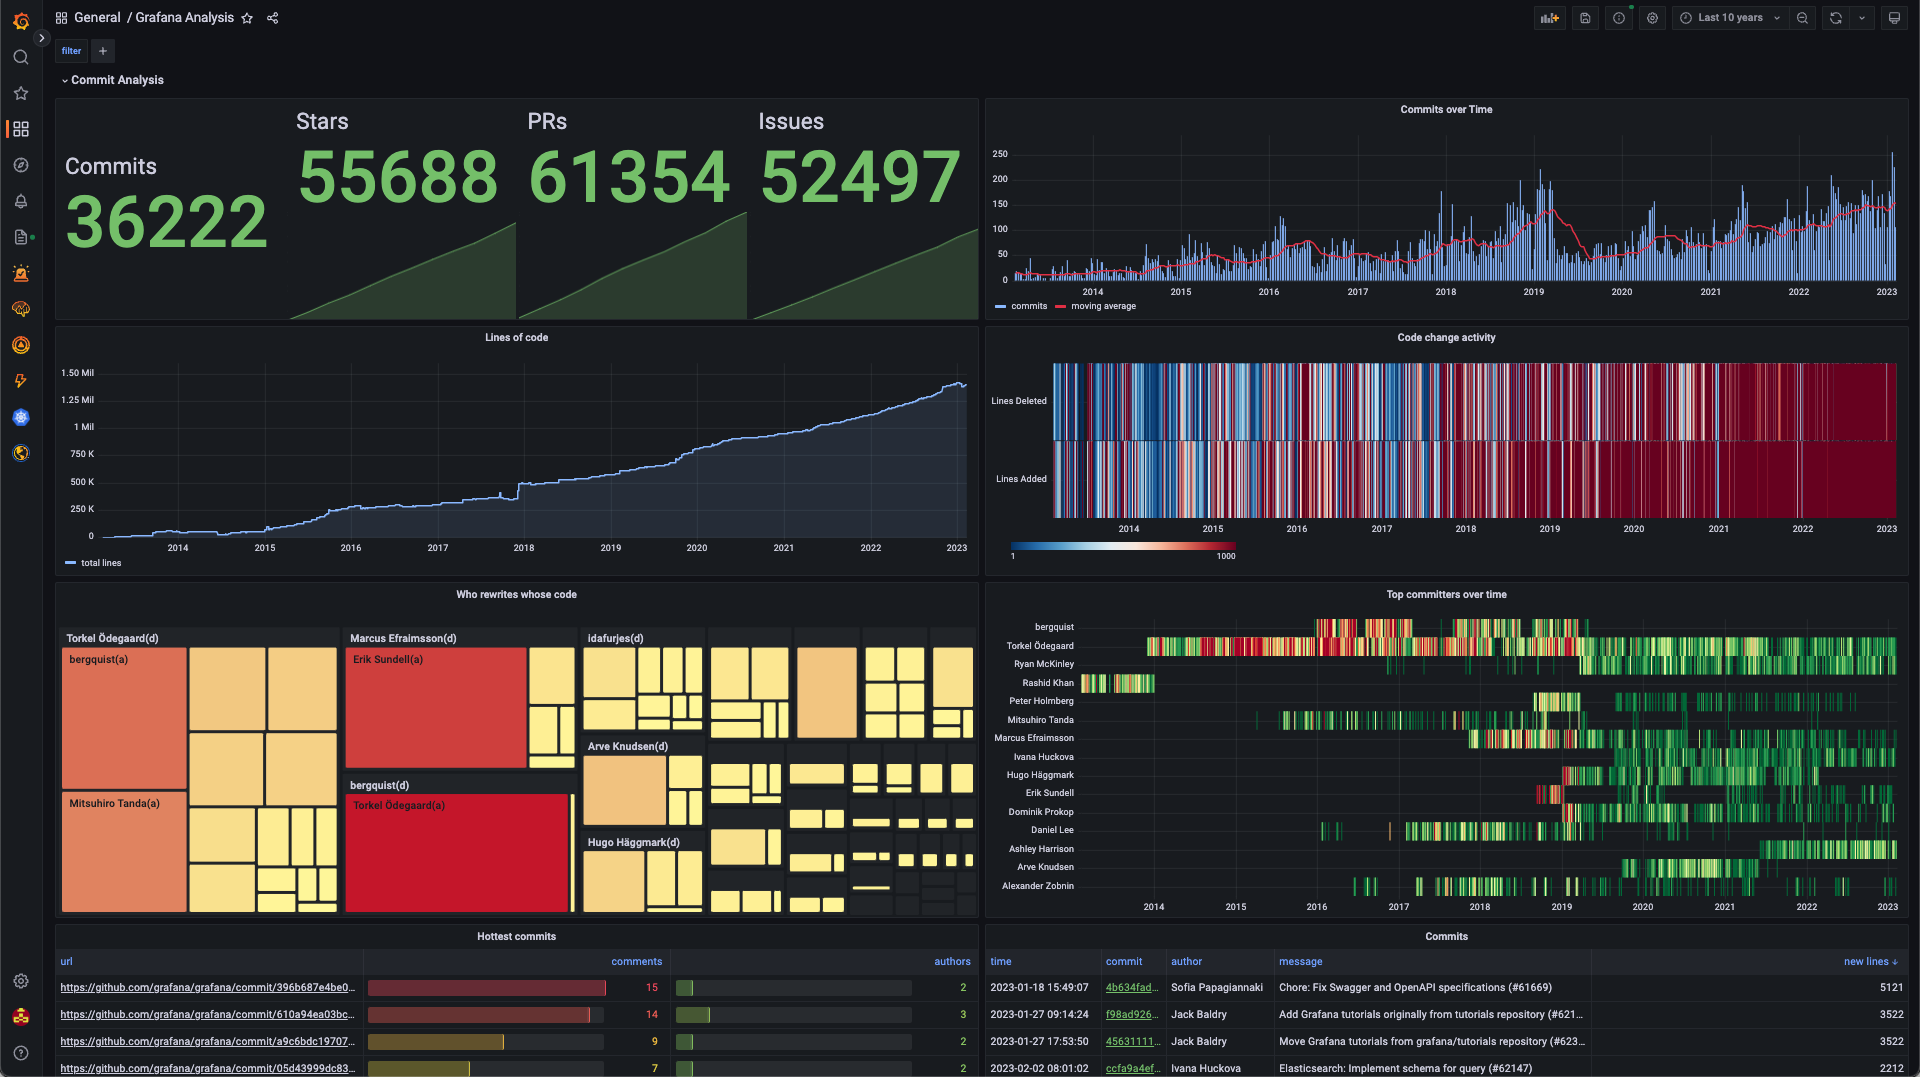
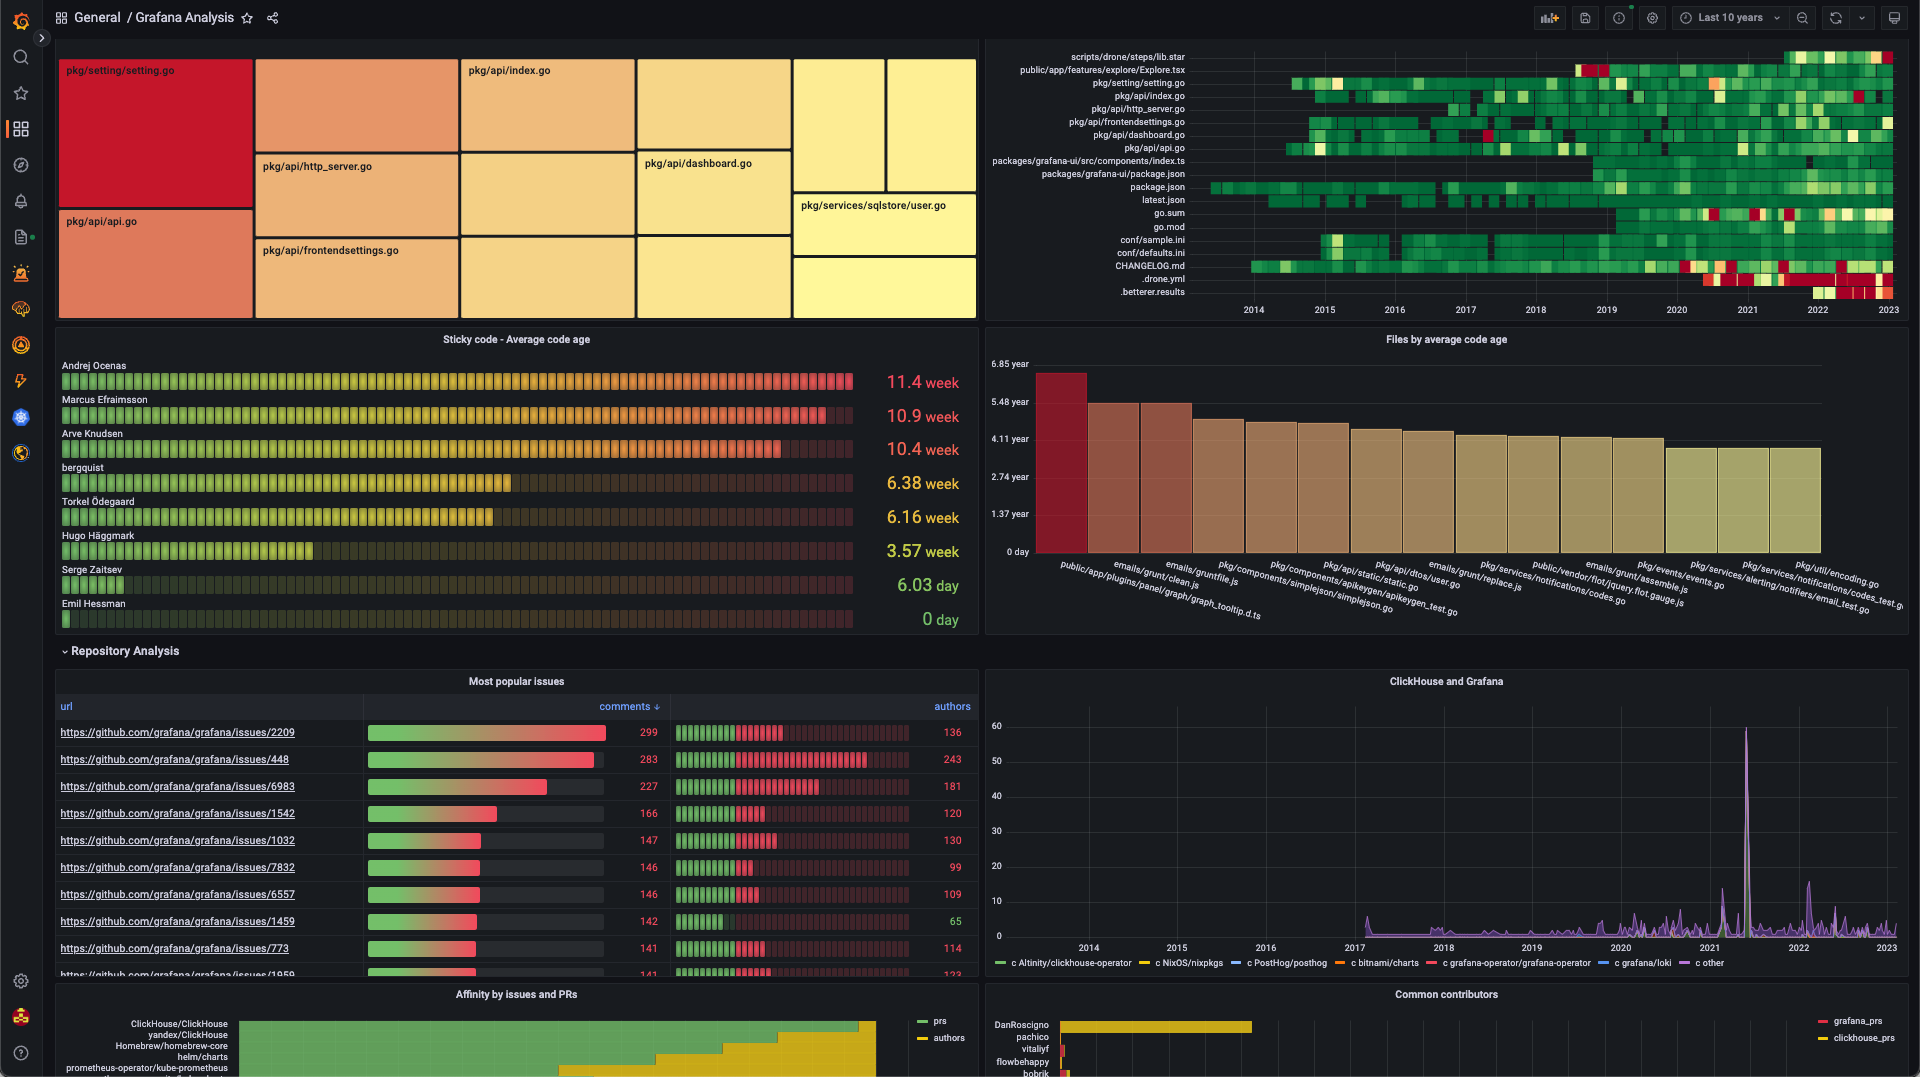
The Grafana Analysis dashboard uses the grafana-clickhouse-datasource data source to create a Grafana dashboard with the barchart, bargauge, heatmap, magnesium-wordcloud-panel, marcusolsson-treemap-panel, piechart, stat, table and timeseries panels.
Data source config
Collector type:
Collector plugins:
Collector config:
Revisions
Upload an updated version of an exported dashboard.json file from Grafana
| Revision | Description | Created | |
|---|---|---|---|
| Download |