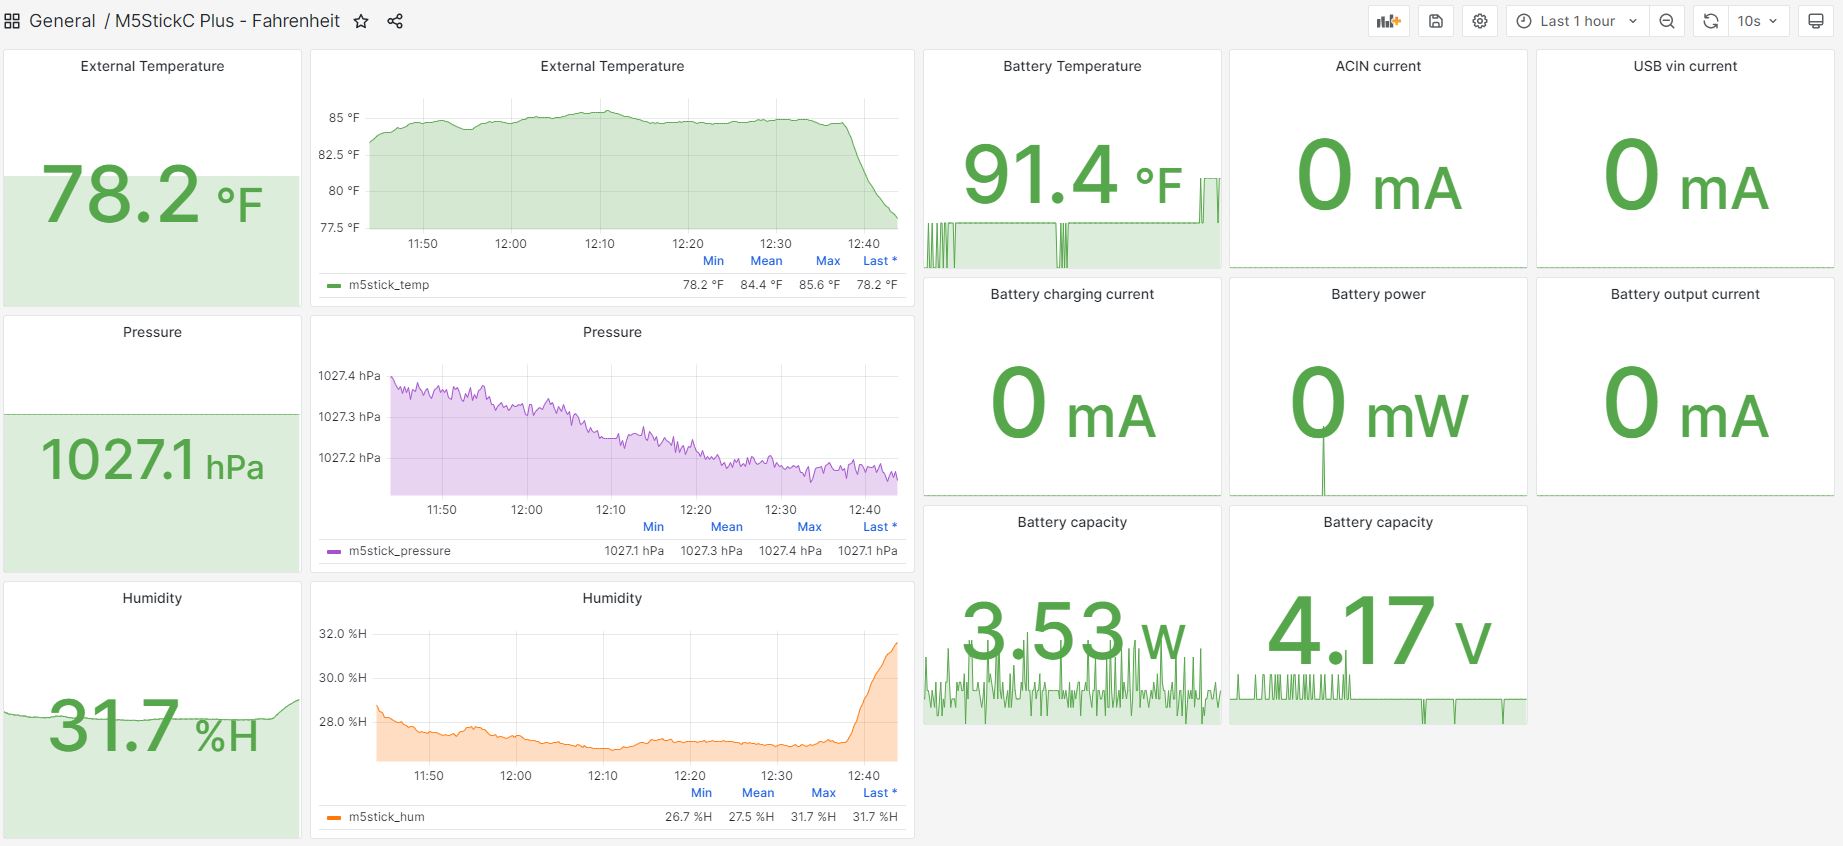
M5StickC Plus - Fahrenheit
Example Dashboard to visualise your temperature/humidity/pressure metrics when pairing the M5StickC Plus with the ENV III sensor.
There is a working example how to push the data (Temperature/Humidity/Pressure) from your M5 StickC Plus and ENV III sensor: https://github.com/willie-engelbrecht/M5StickCPlus
This dashboard will display in °F. For the Celsius version, go here: https://grafana.com/grafana/dashboards/17782-m5stickc-plus/
Data source config
Collector type:
Collector plugins:
Collector config:
Revisions
Upload an updated version of an exported dashboard.json file from Grafana
| Revision | Description | Created | |
|---|---|---|---|
| Download |