RUCKUS MSP Cloud Dashboard - Devices
This Dashboard queries all APs from all the End Customers (tenants) of MSP and show a single windows to monitor
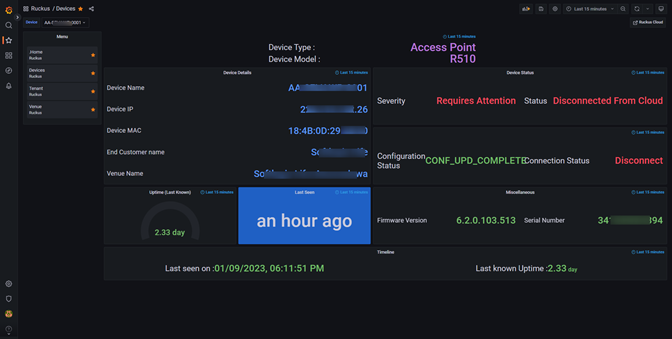
The RUCKUS MSP Cloud Dashboard - Devices dashboard uses the influxdb data source to create a Grafana dashboard with the gauge, grafana-singlestat-panel and stat panels.
Data source config
Collector type:
Collector plugins:
Collector config:
Revisions
Upload an updated version of an exported dashboard.json file from Grafana
| Revision | Description | Created | |
|---|---|---|---|
| Download |