Ondat
Ondat metrics dashboard
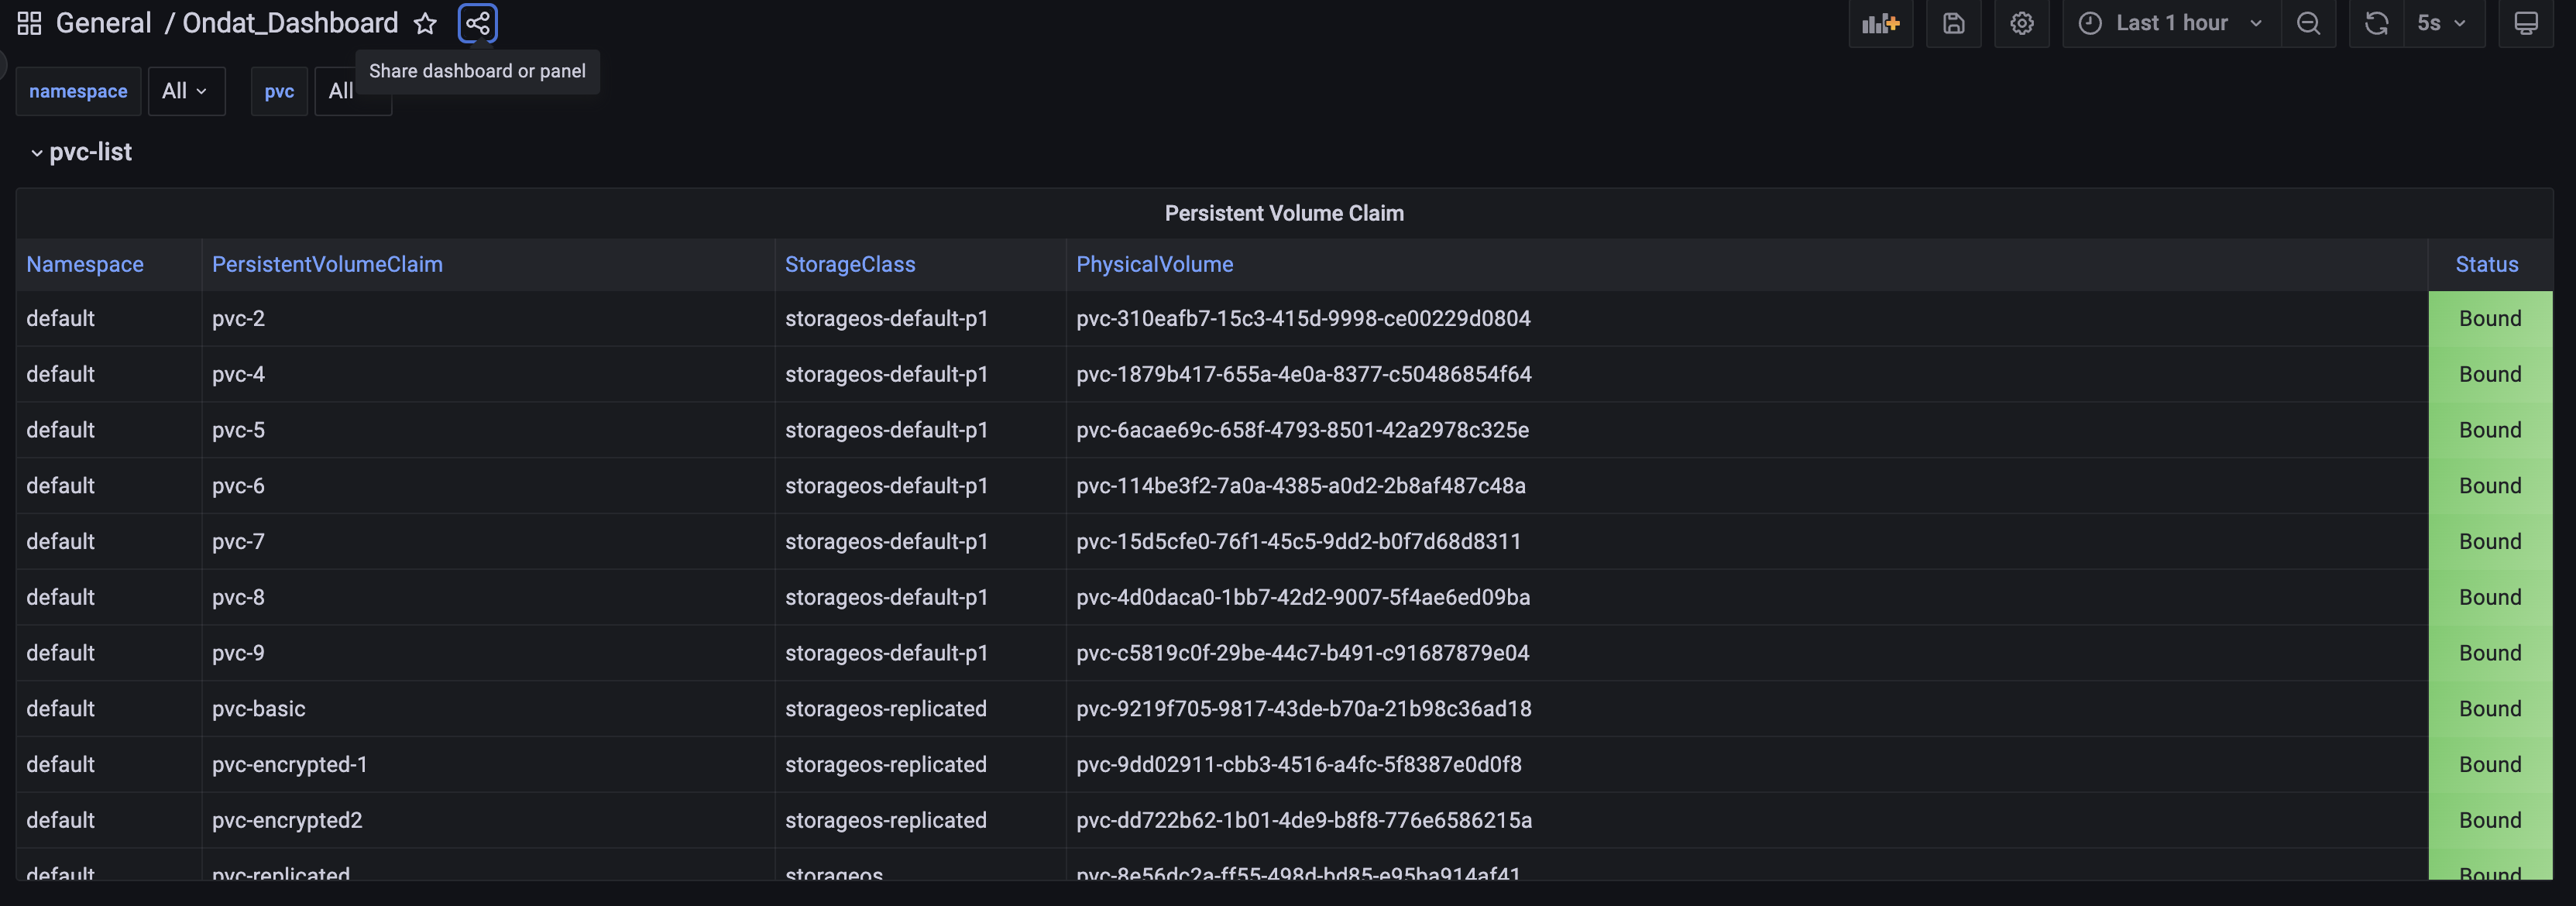
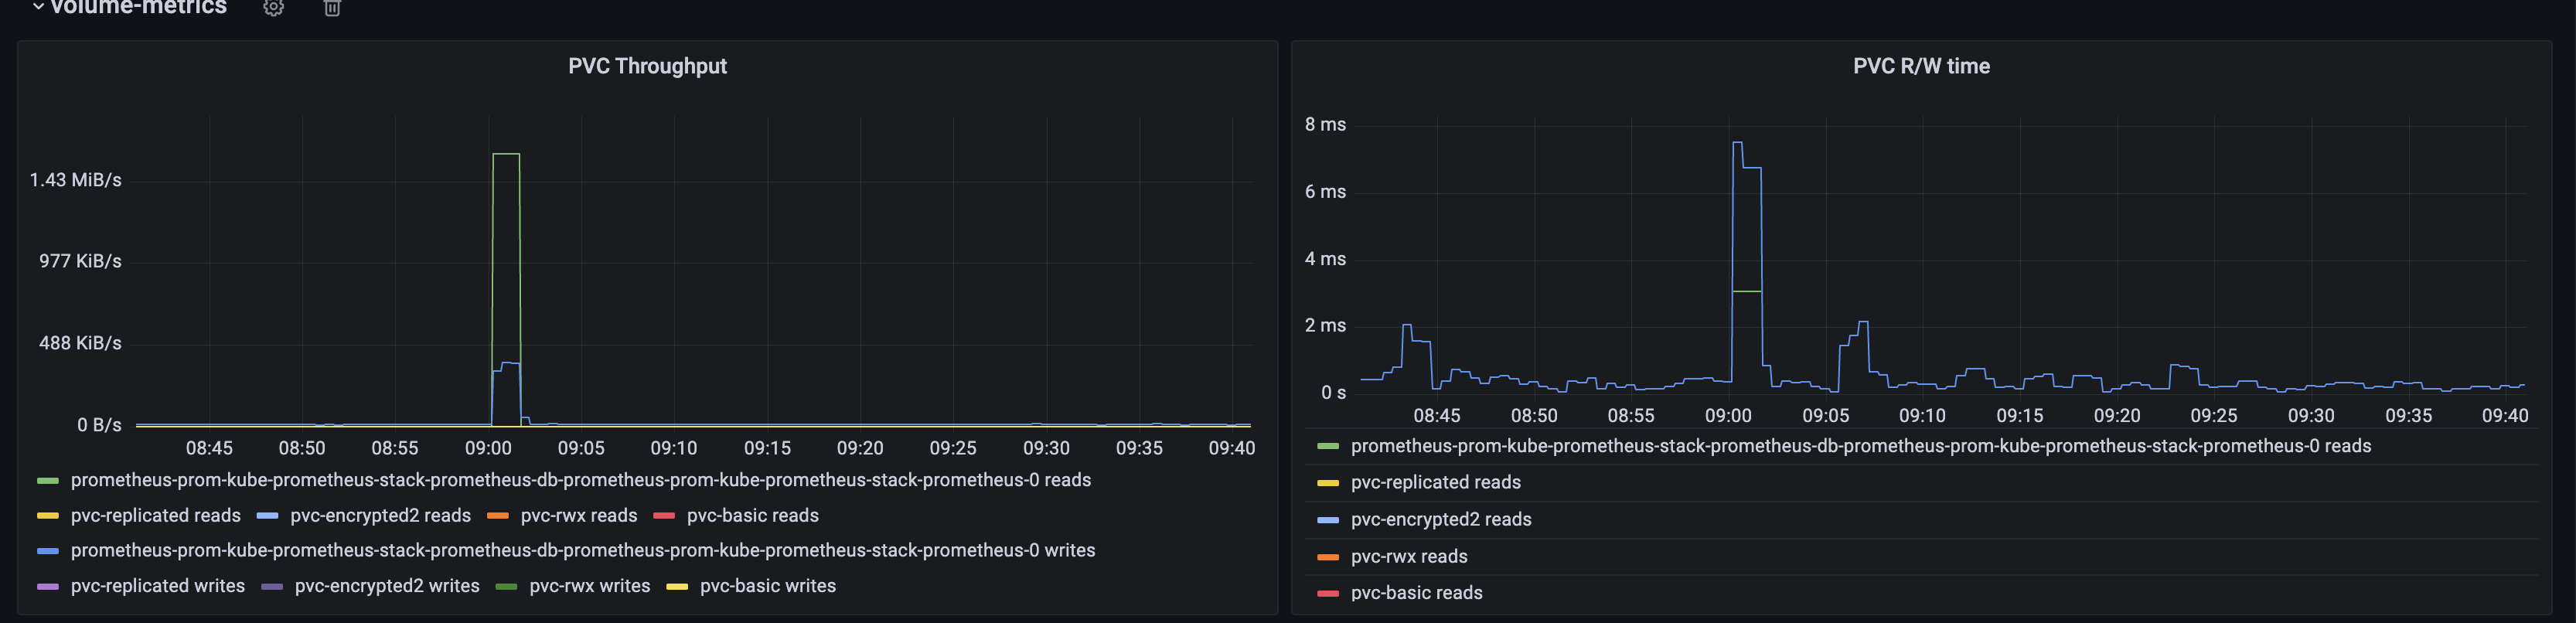
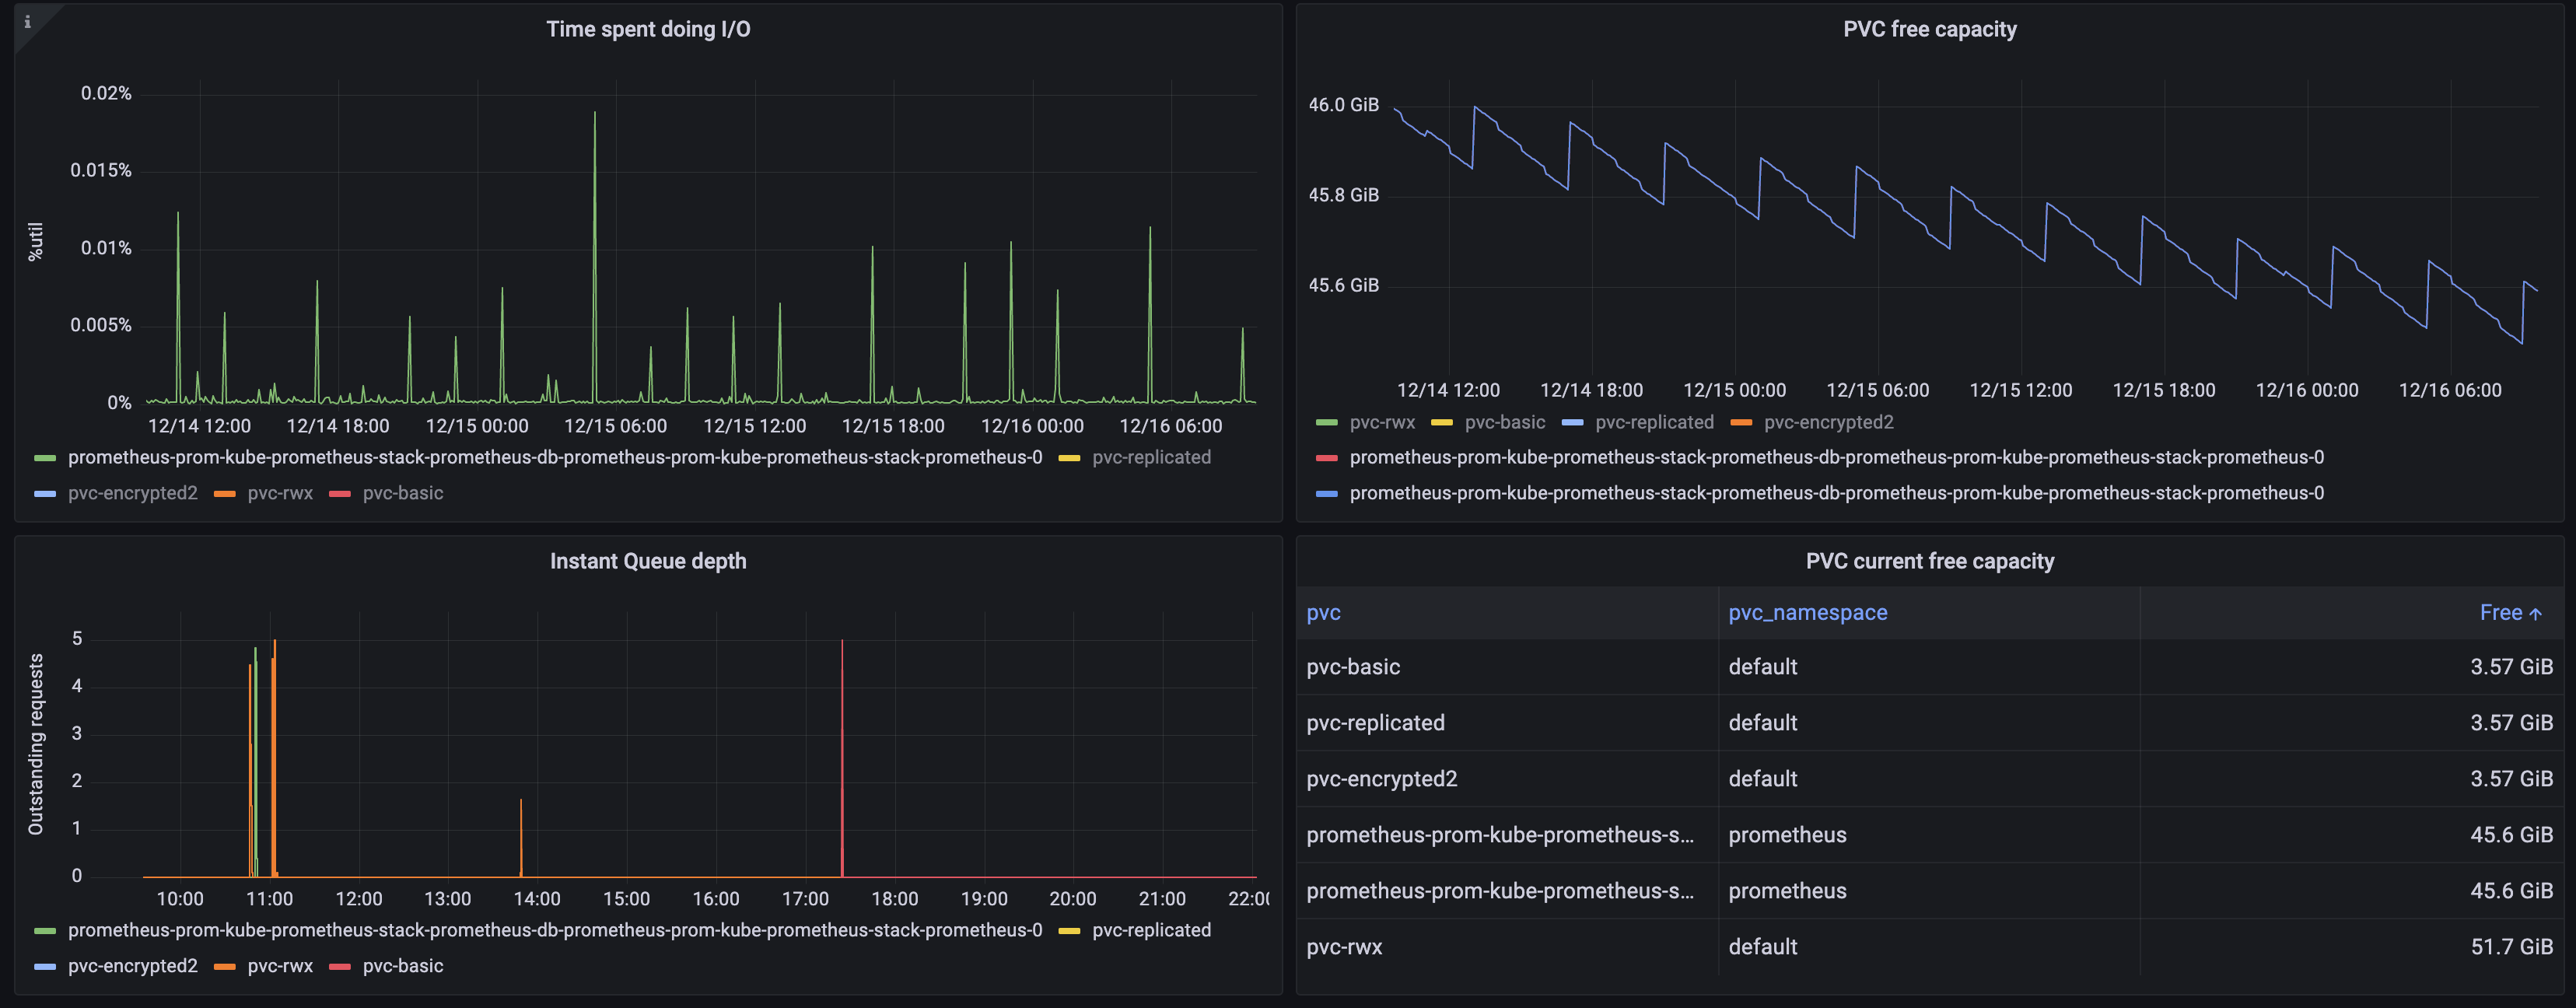
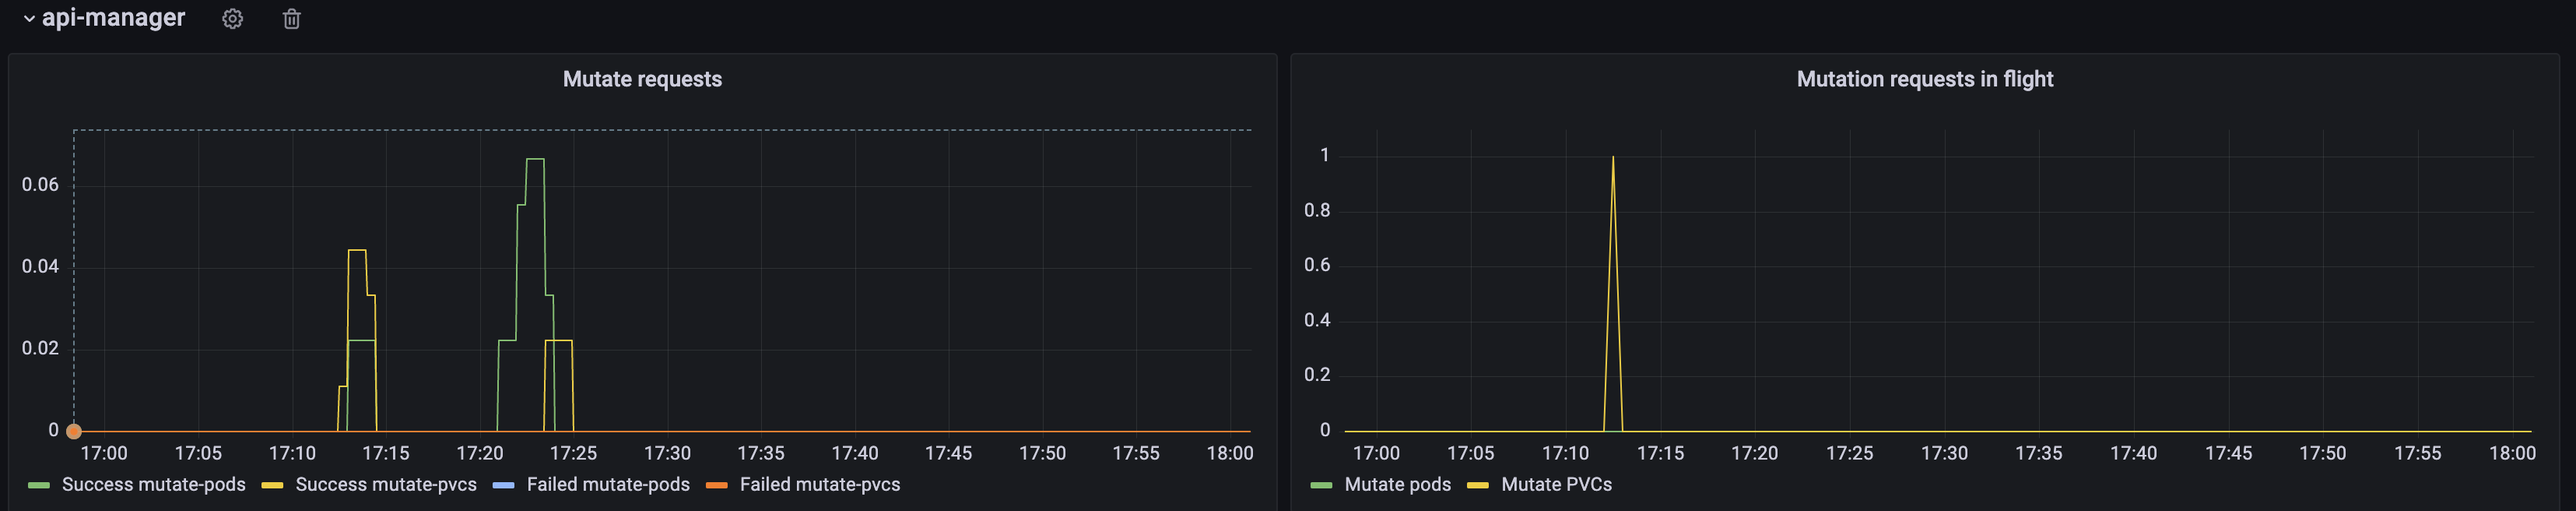
The Ondat dashboard uses the Ondat metrics scraped by Prometheus that allows the observability of Ondat volumes regarding throughput, latency, queue depth, FileSystem usage/free, etc.
The dashboard uses minimally the kube-state-metrics.
Data source config
Collector type:
Collector plugins:
Collector config:
Revisions
Upload an updated version of an exported dashboard.json file from Grafana
| Revision | Description | Created | |
|---|---|---|---|
| Download |