Django / Overview
A landing dashboard for Django services with request health, latency, database activity, cache effectiveness, and drill-down links into high-traffic views. Use it to spot application-wide regressions before moving into the request, view, or model dashboards. The dashboards were generated using [Django-mixin](https://github.com/adinhodovic/django-mixin). Open issues and create feature requests in the repository.
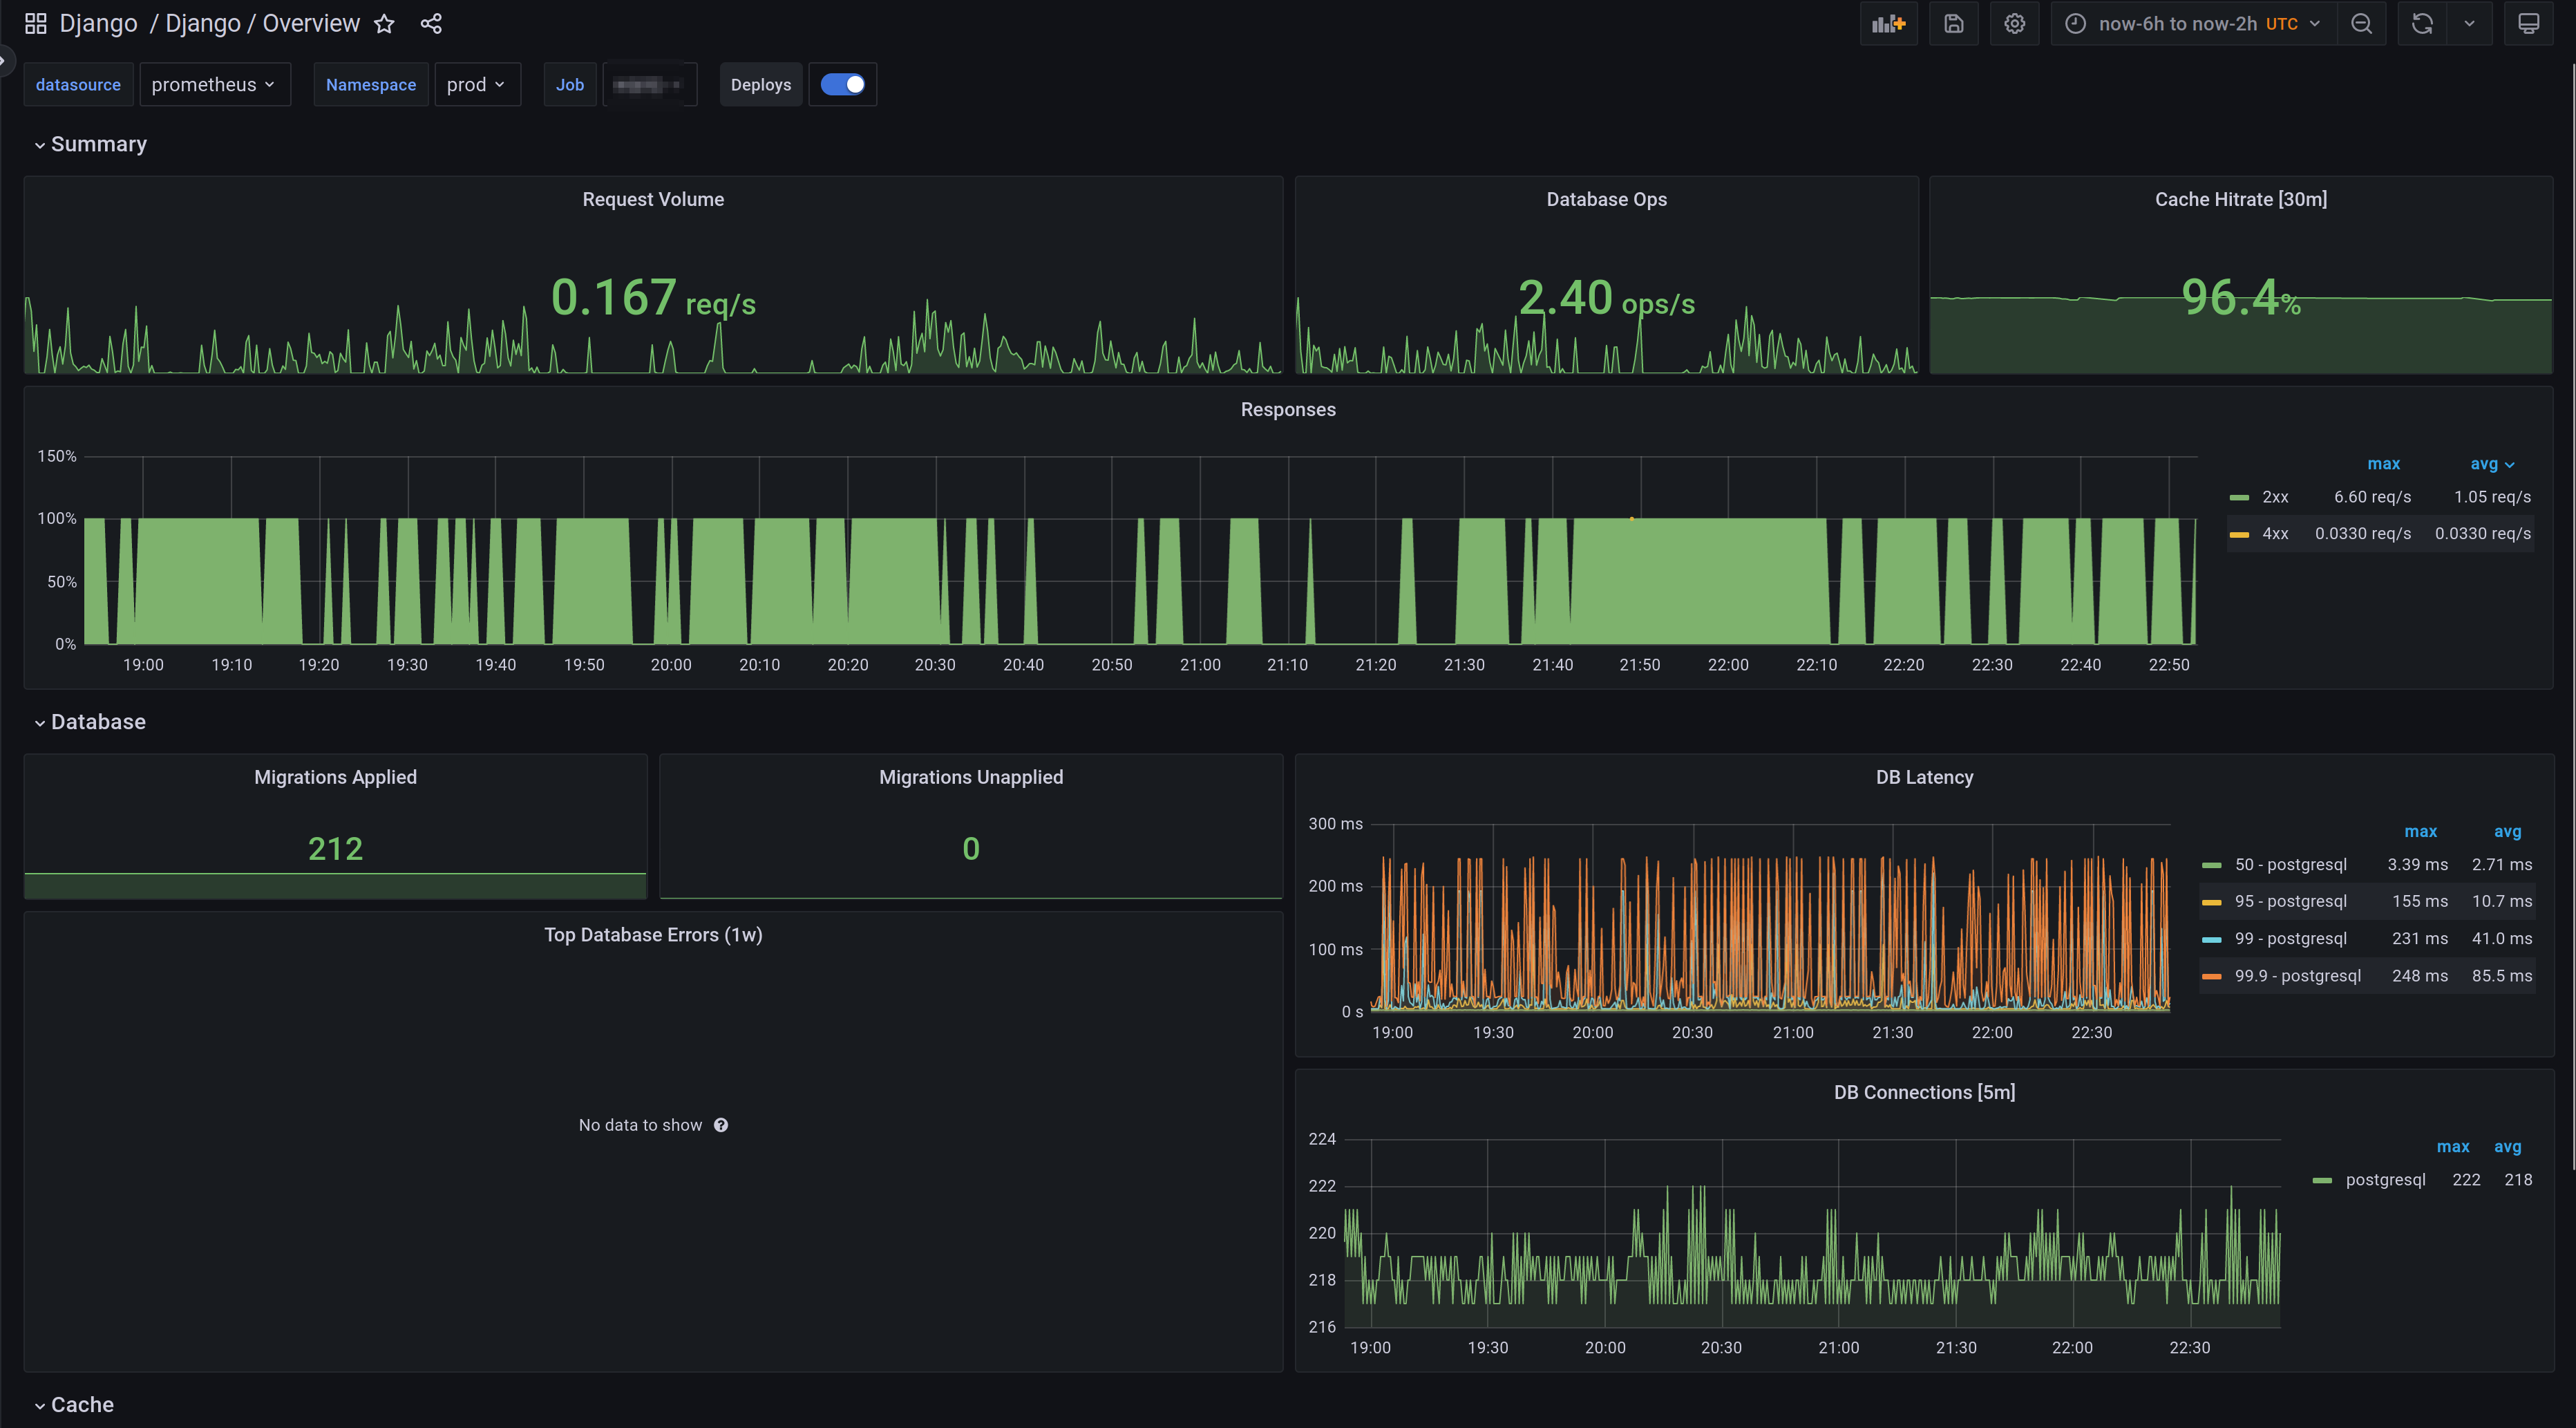

A dashboard that monitors Django which focuses on giving a overview for the system (requests, db, cache). It is created using the Django-mixin.
Data source config
Collector type:
Collector plugins:
Collector config:
Revisions
Upload an updated version of an exported dashboard.json file from Grafana
| Revision | Description | Created | |
|---|---|---|---|
| Download |