Redis Overview
Redis Dashboard for Prometheus Redis Exporter 1.x
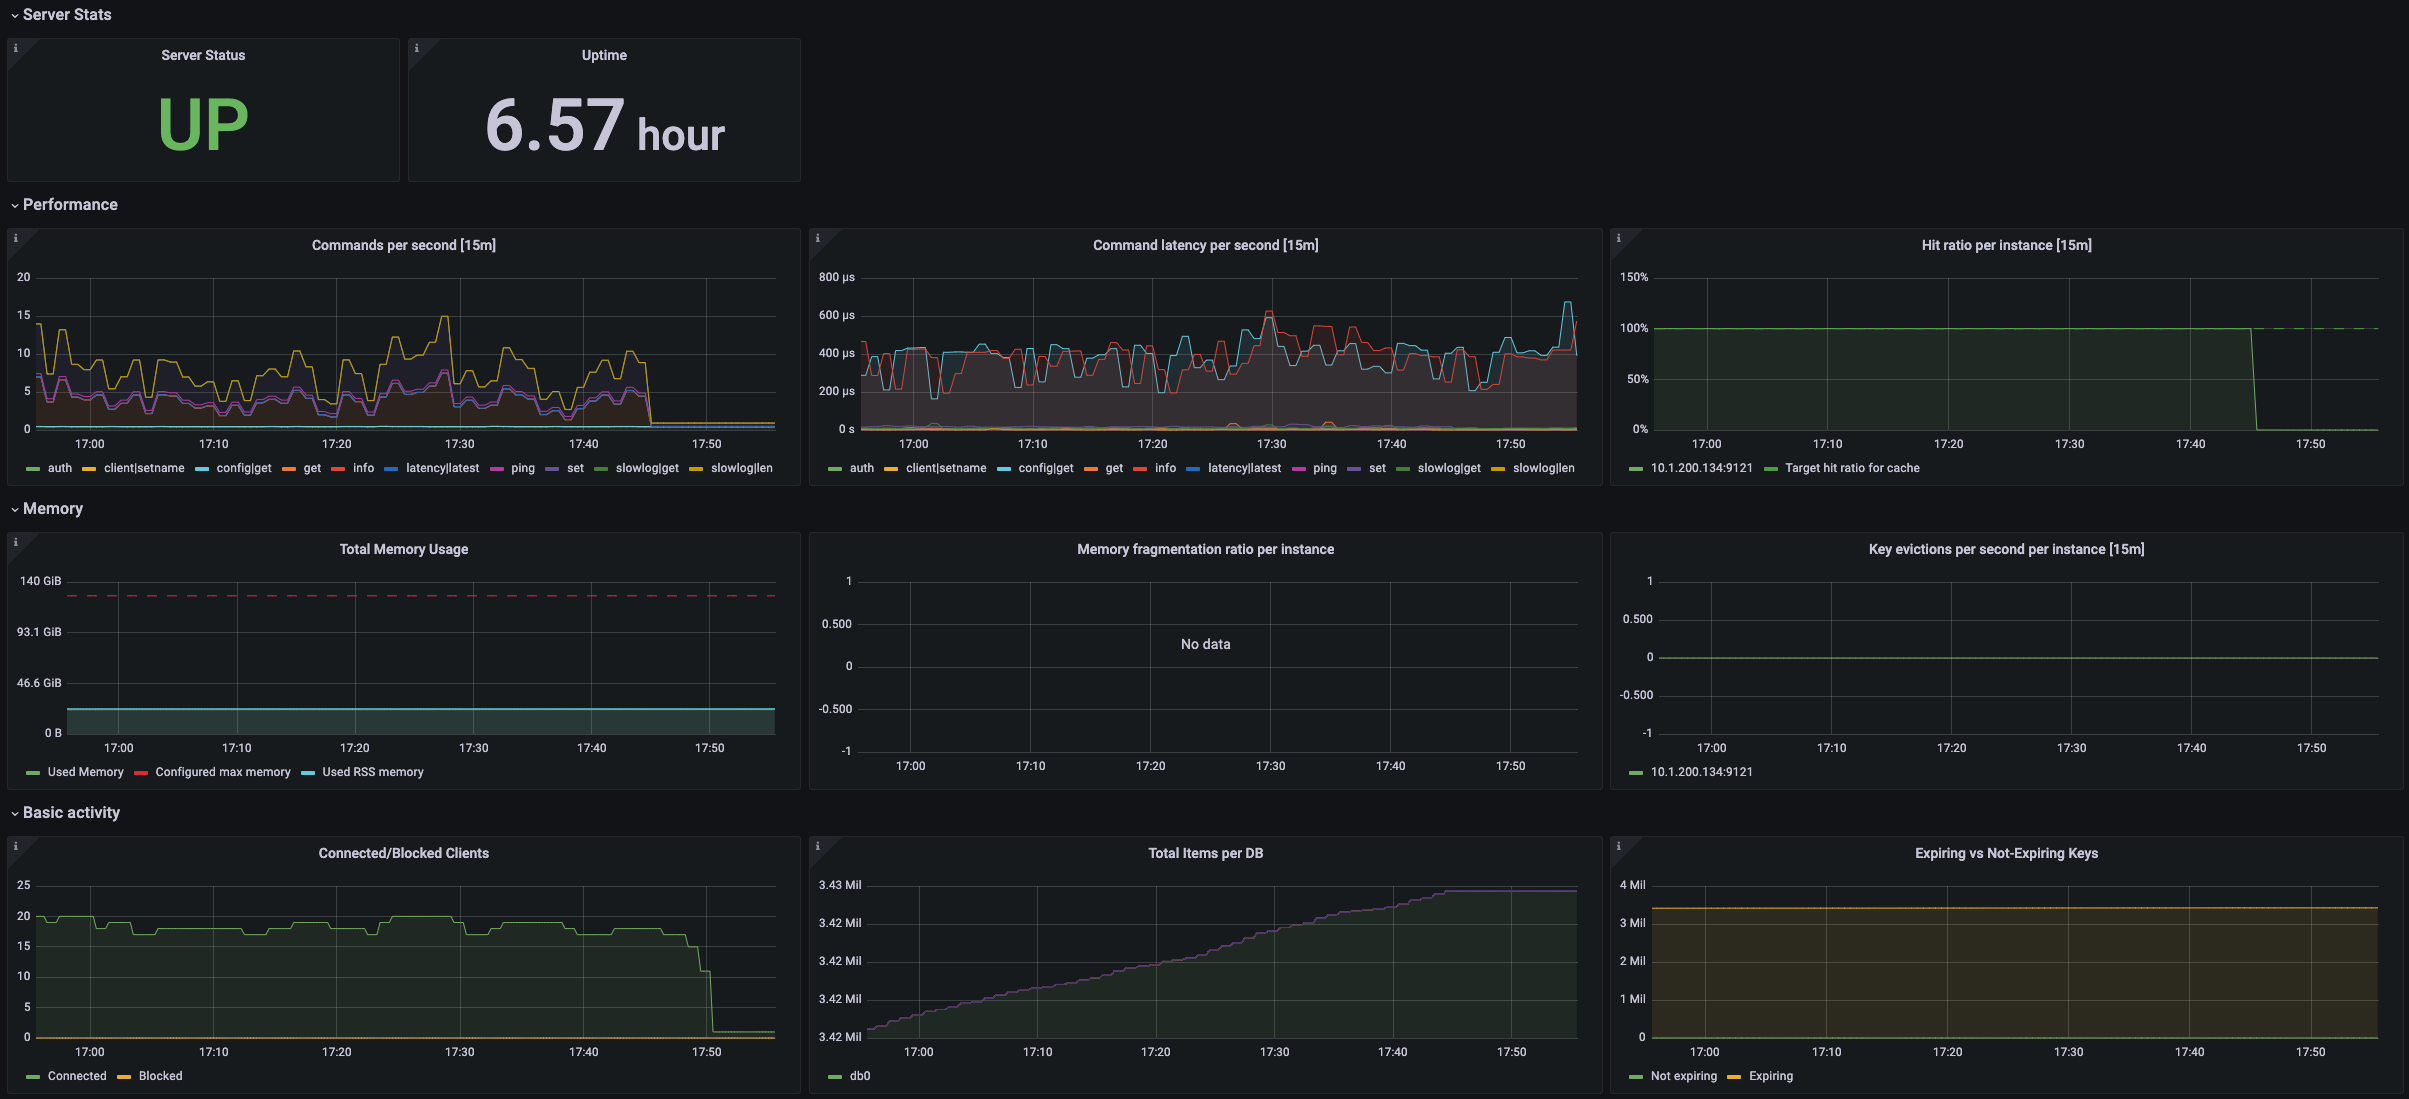
Custom Redis Node Exporter dashboard for Grafana that displays:
- Server Statiscs: Uptime
- Basic Activity
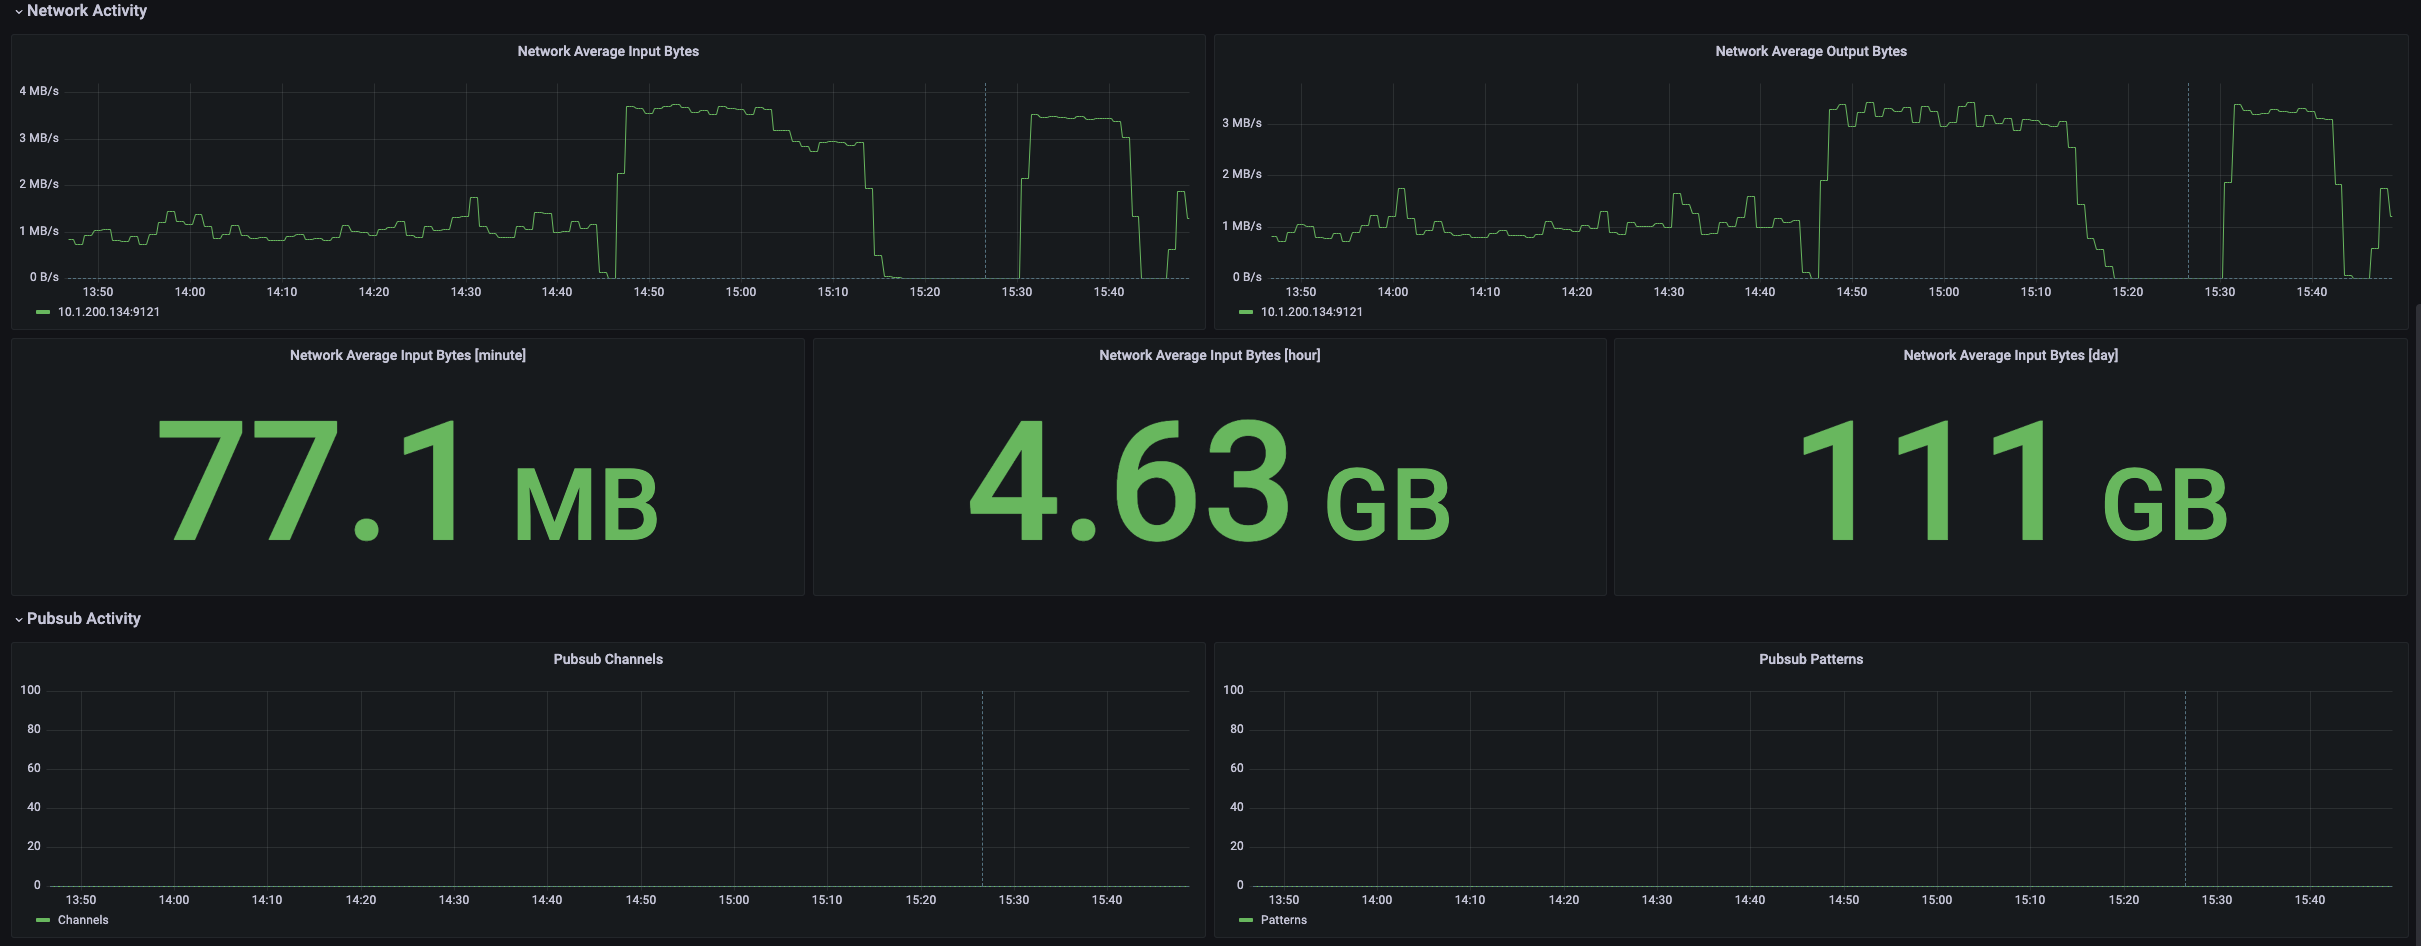
- Pubsub activity
- Network Activity
- Performance
- Memory
Data source config
Collector type:
Collector plugins:
Collector config:
Revisions
Upload an updated version of an exported dashboard.json file from Grafana
| Revision | Description | Created | |
|---|---|---|---|
| Download |
Redis
Monitor Redis with Grafana. Easily monitor your Redis deployment with Grafana Cloud's out-of-the-box monitoring solution.
Learn more