Section Project
This dashboard can be used along with Section and this guide to view your data in grafana or grafana cloud using prometheus https://www.section.io/docs/guides/monitor/exporting-telemetry/grafana-section/
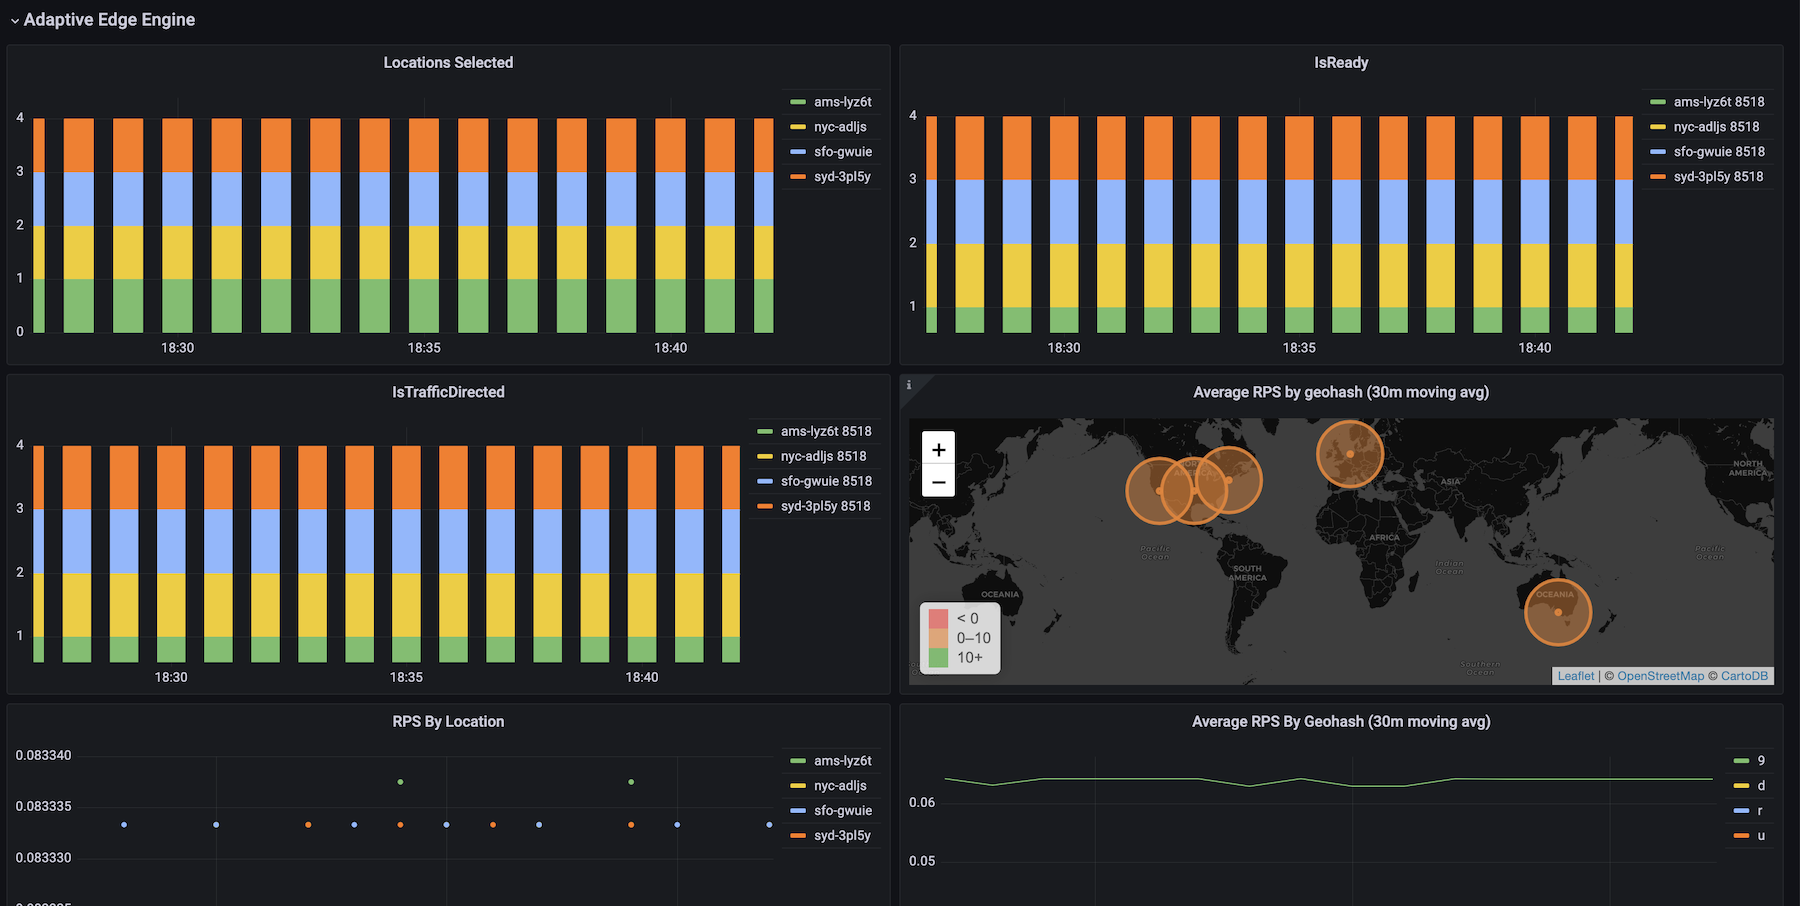
The Section Project dashboard uses the prometheus data source to create a Grafana dashboard with the grafana-worldmap-panel and timeseries panels.
Data source config
Collector type:
Collector plugins:
Collector config:
Revisions
Upload an updated version of an exported dashboard.json file from Grafana
| Revision | Description | Created | |
|---|---|---|---|
| Download |