TrueNAS Core dashboard
A modified version of the dashboard shared by cucac - https://grafana.com/orgs/cucac Instructions on how to set it up can be found here: https://github.com/cucac/truenas-influxdb-grafana
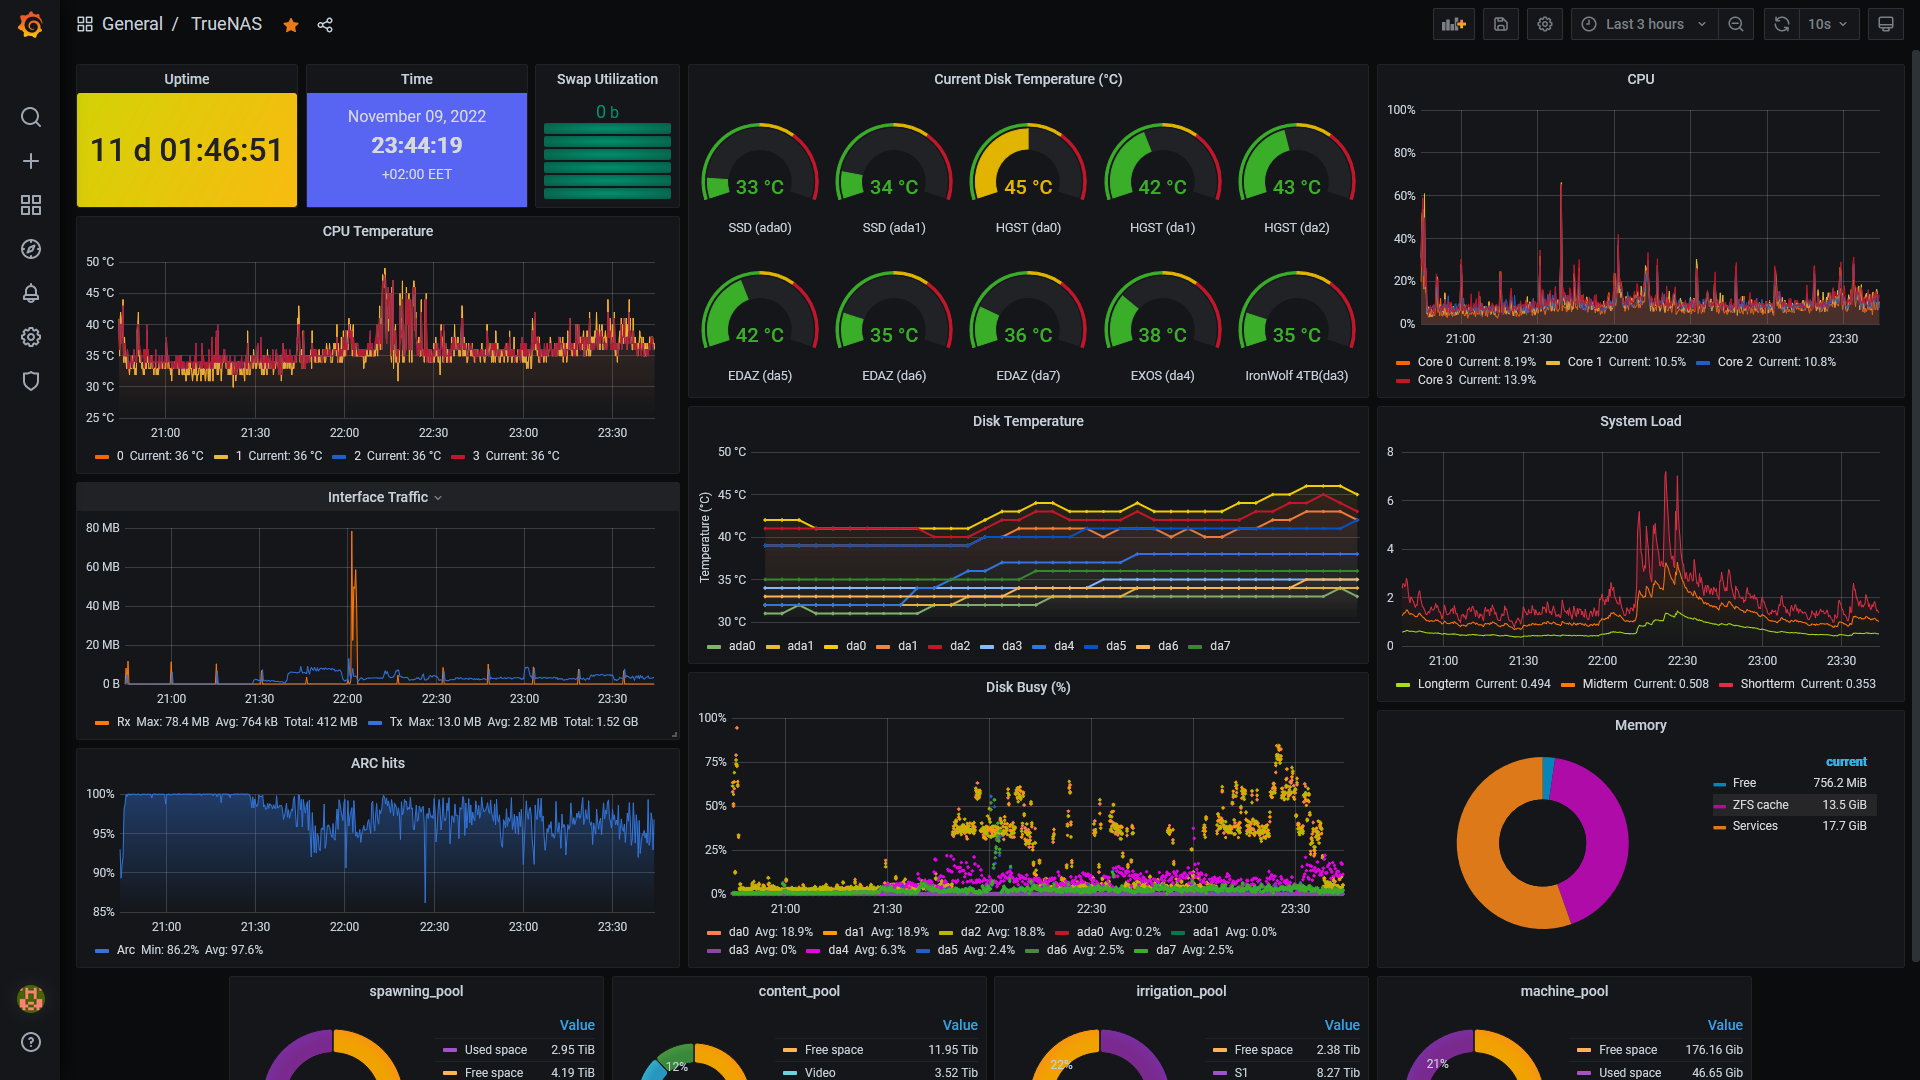
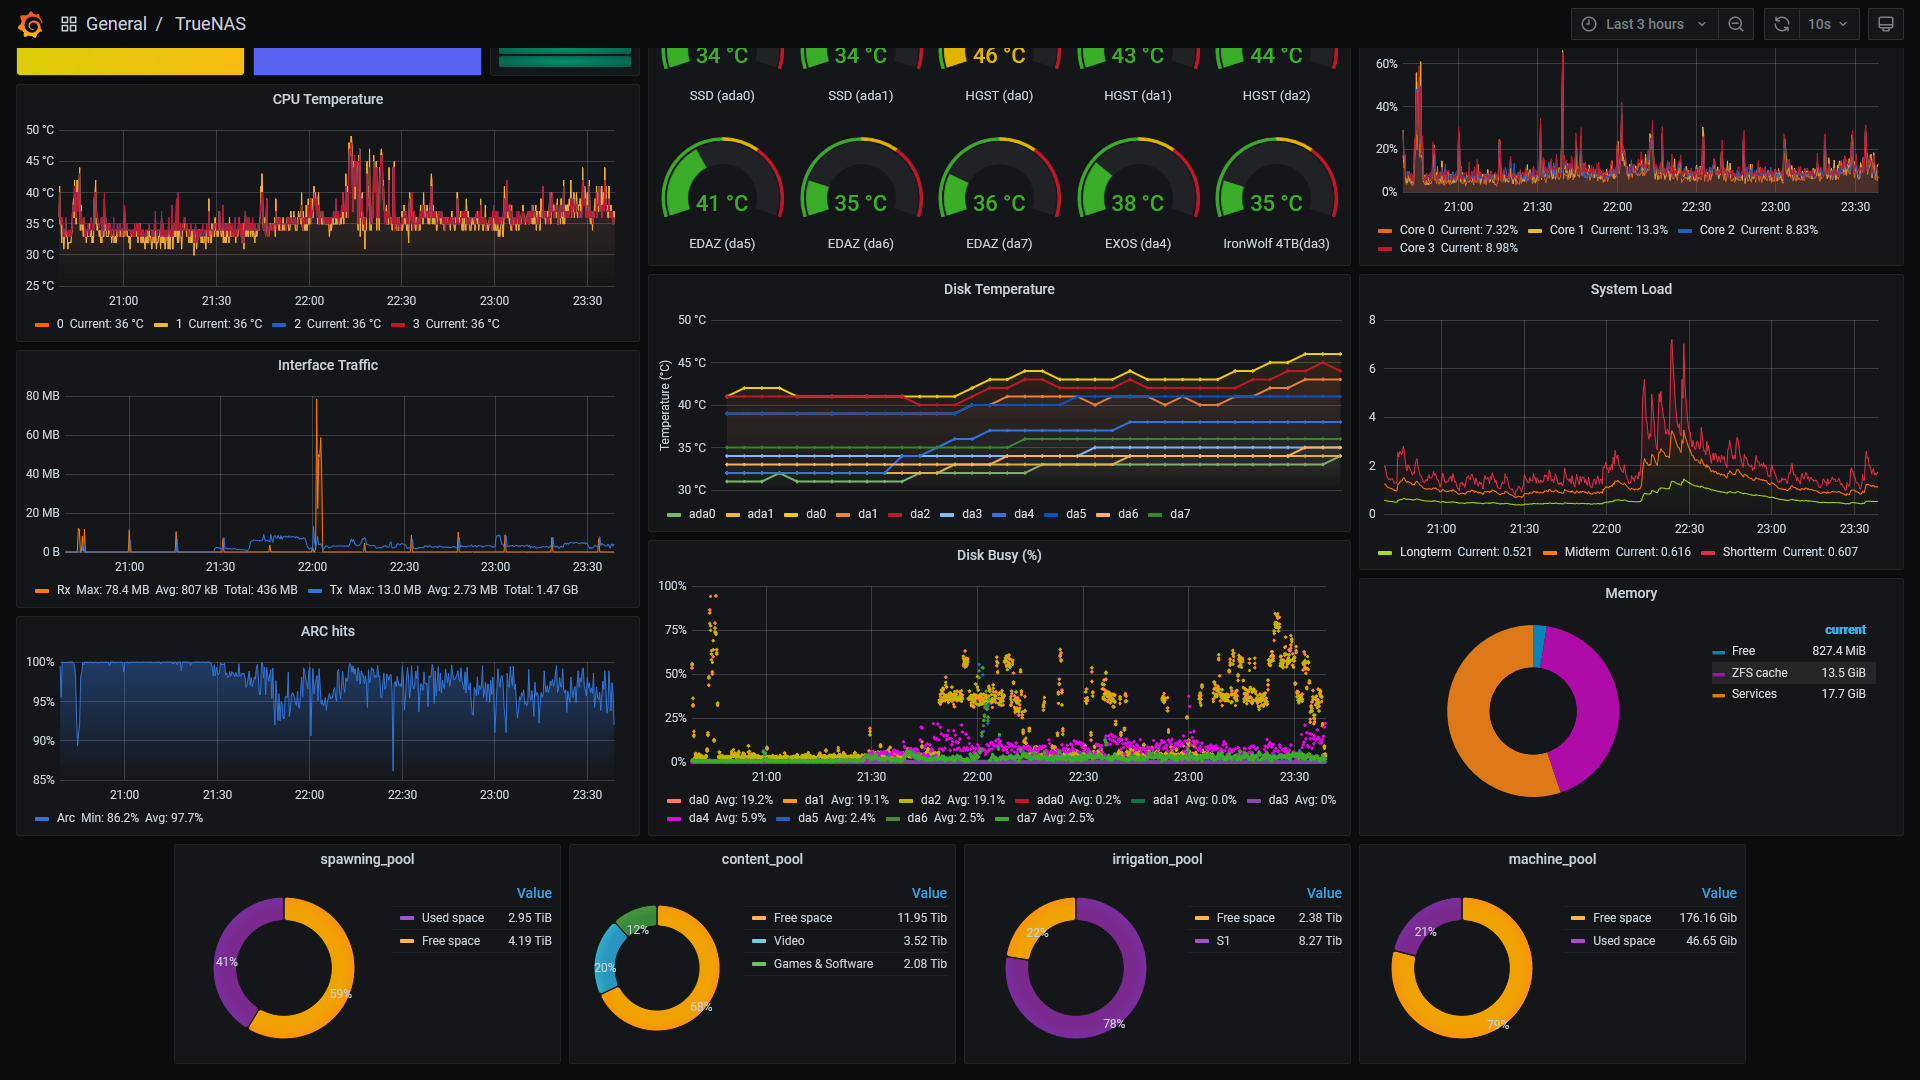
The TrueNAS Core dashboard dashboard uses the __expr__ data source to create a Grafana dashboard with the bargauge, gauge, grafana-clock-panel, grafana-piechart-panel, graph, piechart and stat panels.
Data source config
Collector type:
Collector plugins:
Collector config:
Revisions
Upload an updated version of an exported dashboard.json file from Grafana
| Revision | Description | Created | |
|---|---|---|---|
| Download |