Kubernetes Logs in ClickHouse
Simple dashboard for visualizing Kubernetes logs in ClickHouse
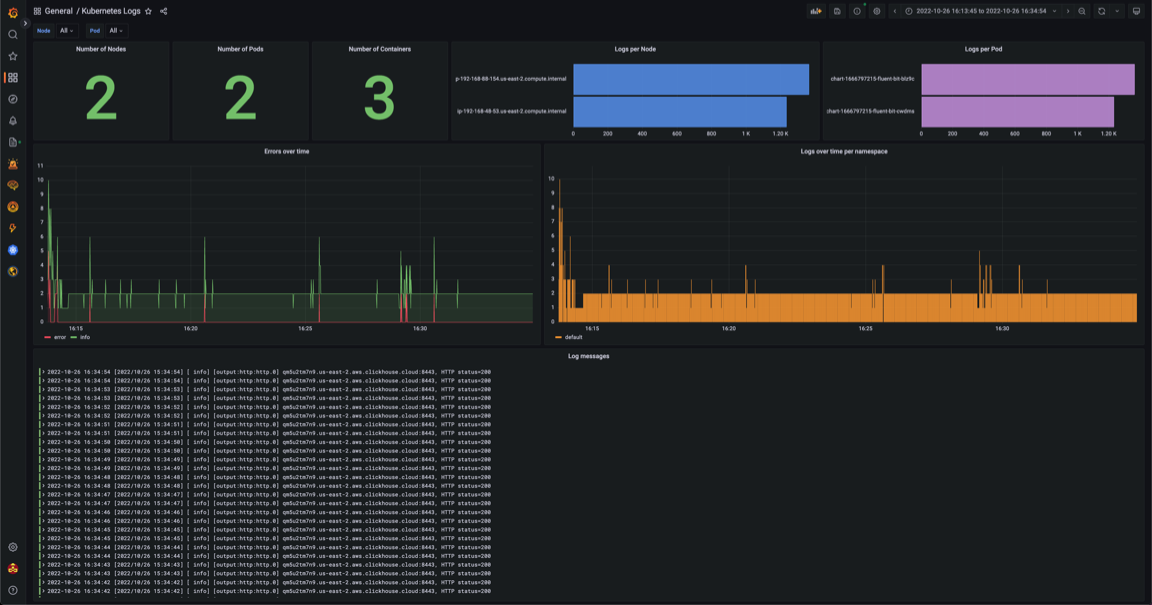
Dashboard to accompany blog on loading Sending Kubernetes logs To ClickHouse with Fluent Bit.
Data source config
Collector type:
Collector plugins:
Collector config:
Revisions
Upload an updated version of an exported dashboard.json file from Grafana
| Revision | Description | Created | |
|---|---|---|---|
| Download |
Kubernetes
Monitor your Kubernetes deployment with prebuilt visualizations that allow you to drill down from a high-level cluster overview to pod-specific details in minutes.
Learn more