Java/JMX
Dashboard for JVM metrics with Prometheus / JMX Exporter
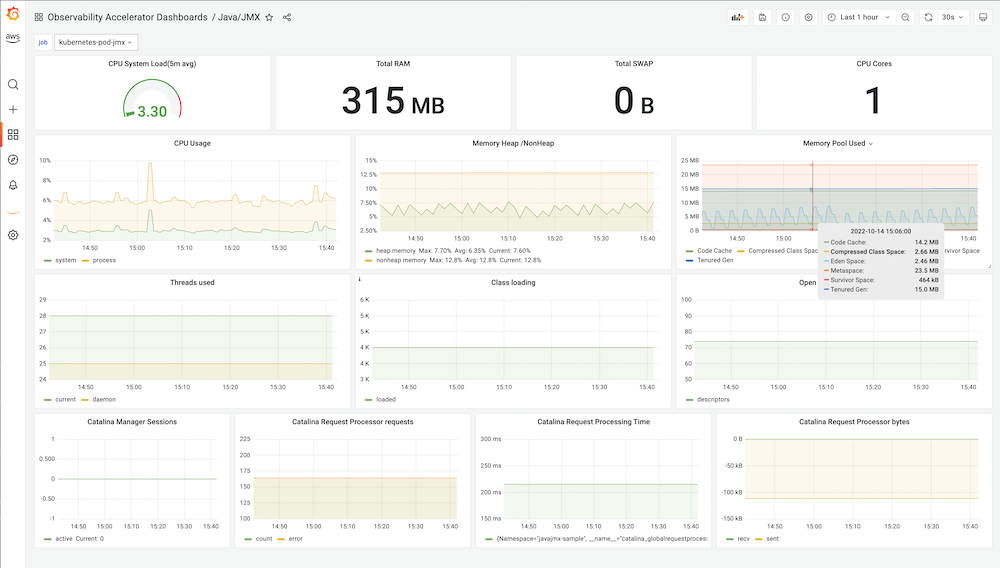
This dashboard is part of the AWS Observability Accelerator and enables you to monitor JVM metrics with Prometheus / JMX Exporter.
For an automated end-to-end setup based on Terraform as well as to provide feedback or report an issue with the dashboard, please visit the AWS Observability Accelerator GitHub repo.
Data source config
Collector type:
Collector plugins:
Collector config:
Revisions
Upload an updated version of an exported dashboard.json file from Grafana
| Revision | Description | Created | |
|---|---|---|---|
| Download |