Podman
Podman exporter dashboard https://github.com/containers/prometheus-podman-exporter
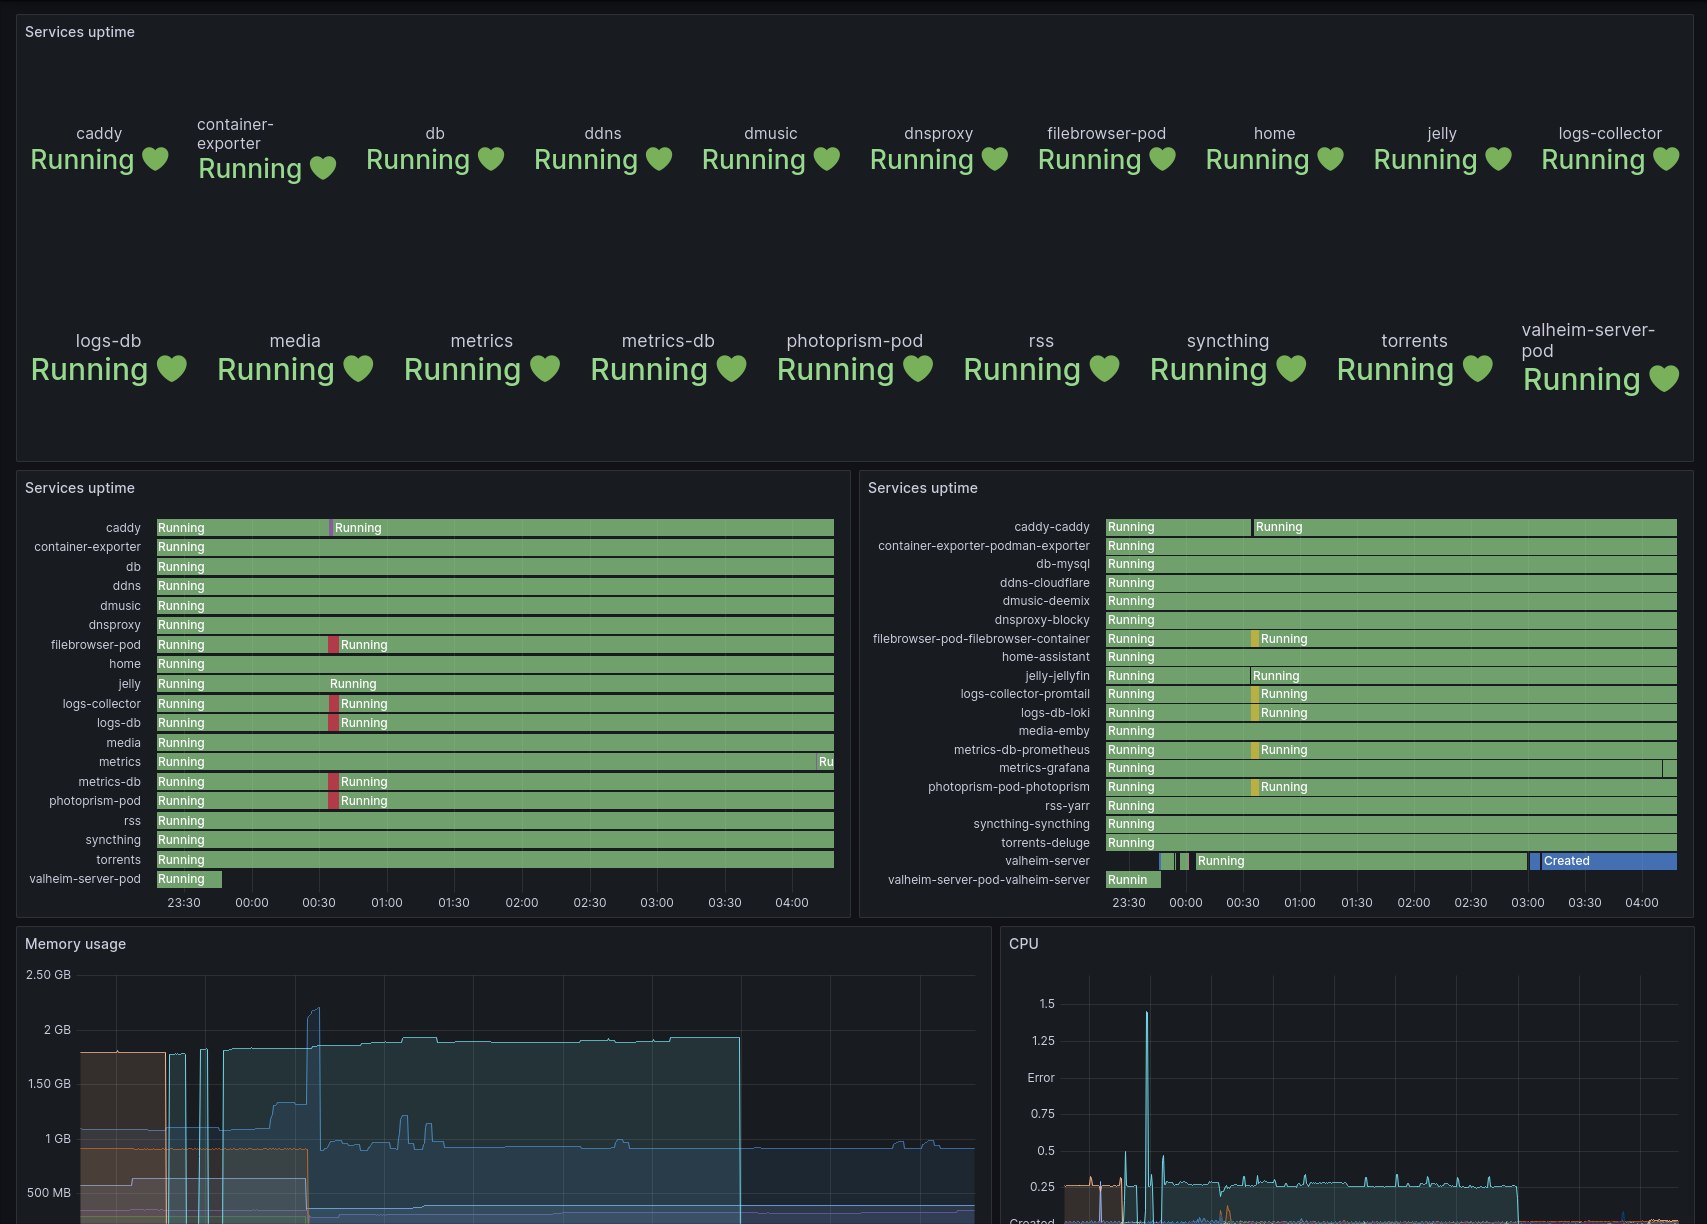
This dashboard display metrics per Podman pod based on the Podman prometheus exporter
- Network input/output
- CPU Usage
- Memory usage
- Pod state
Data source config
Collector type:
Collector plugins:
Collector config:
Revisions
Upload an updated version of an exported dashboard.json file from Grafana
| Revision | Description | Created | |
|---|---|---|---|
| Download |