Spring Boot Endpoint Metrics
Métricas de Quantidade de request de sucesso, erro, warning, spring data, entity, resilience retry, CPU e memória e outros
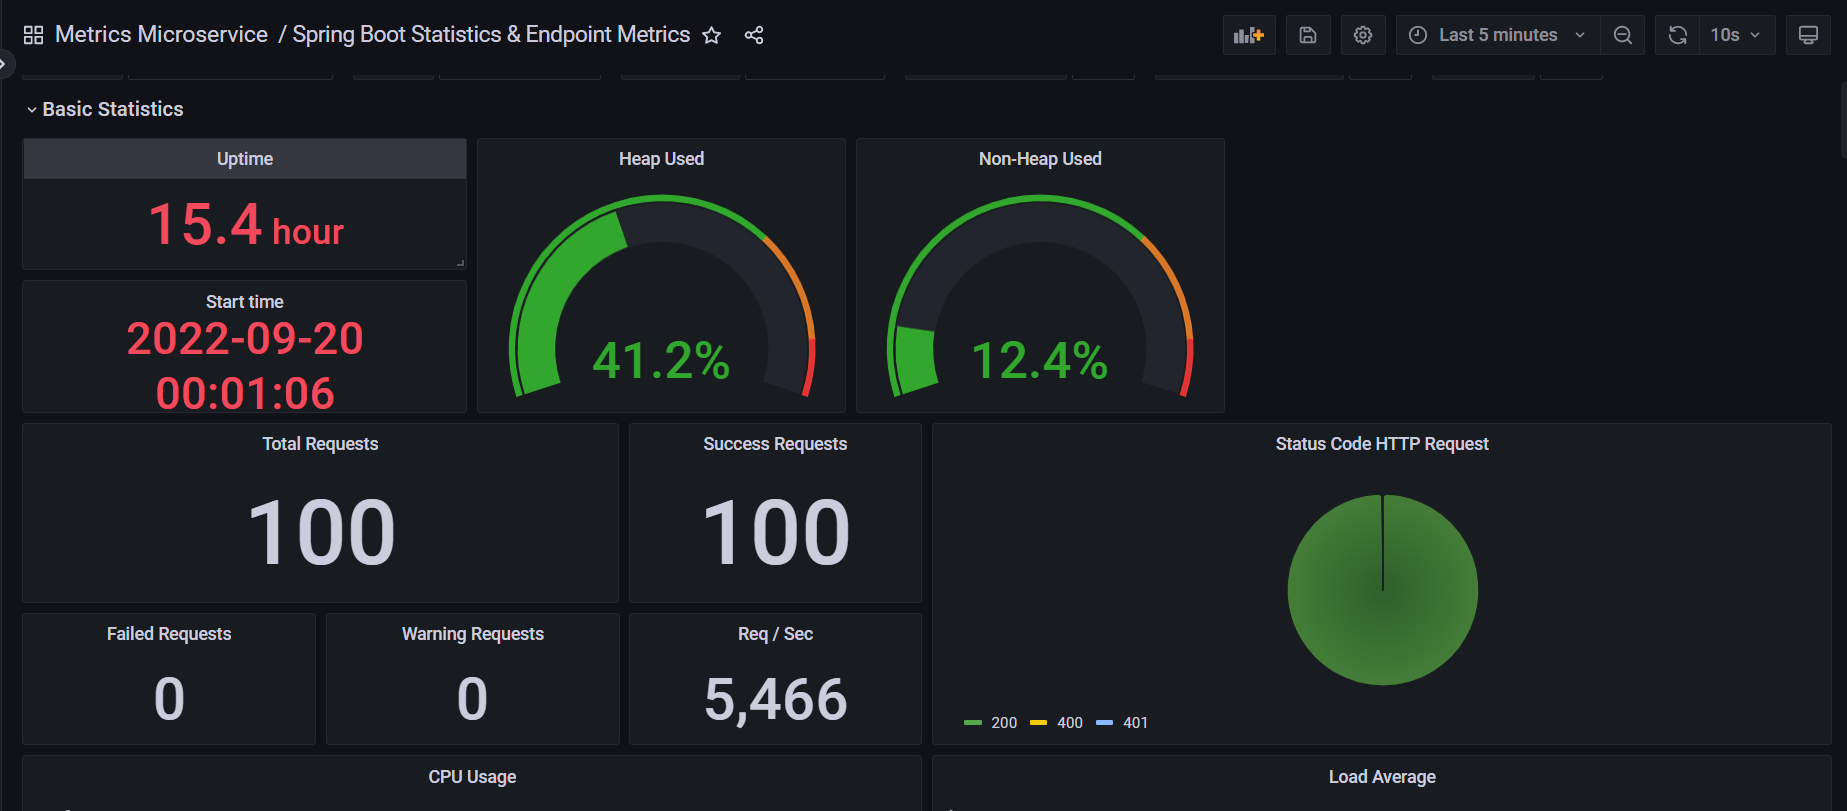
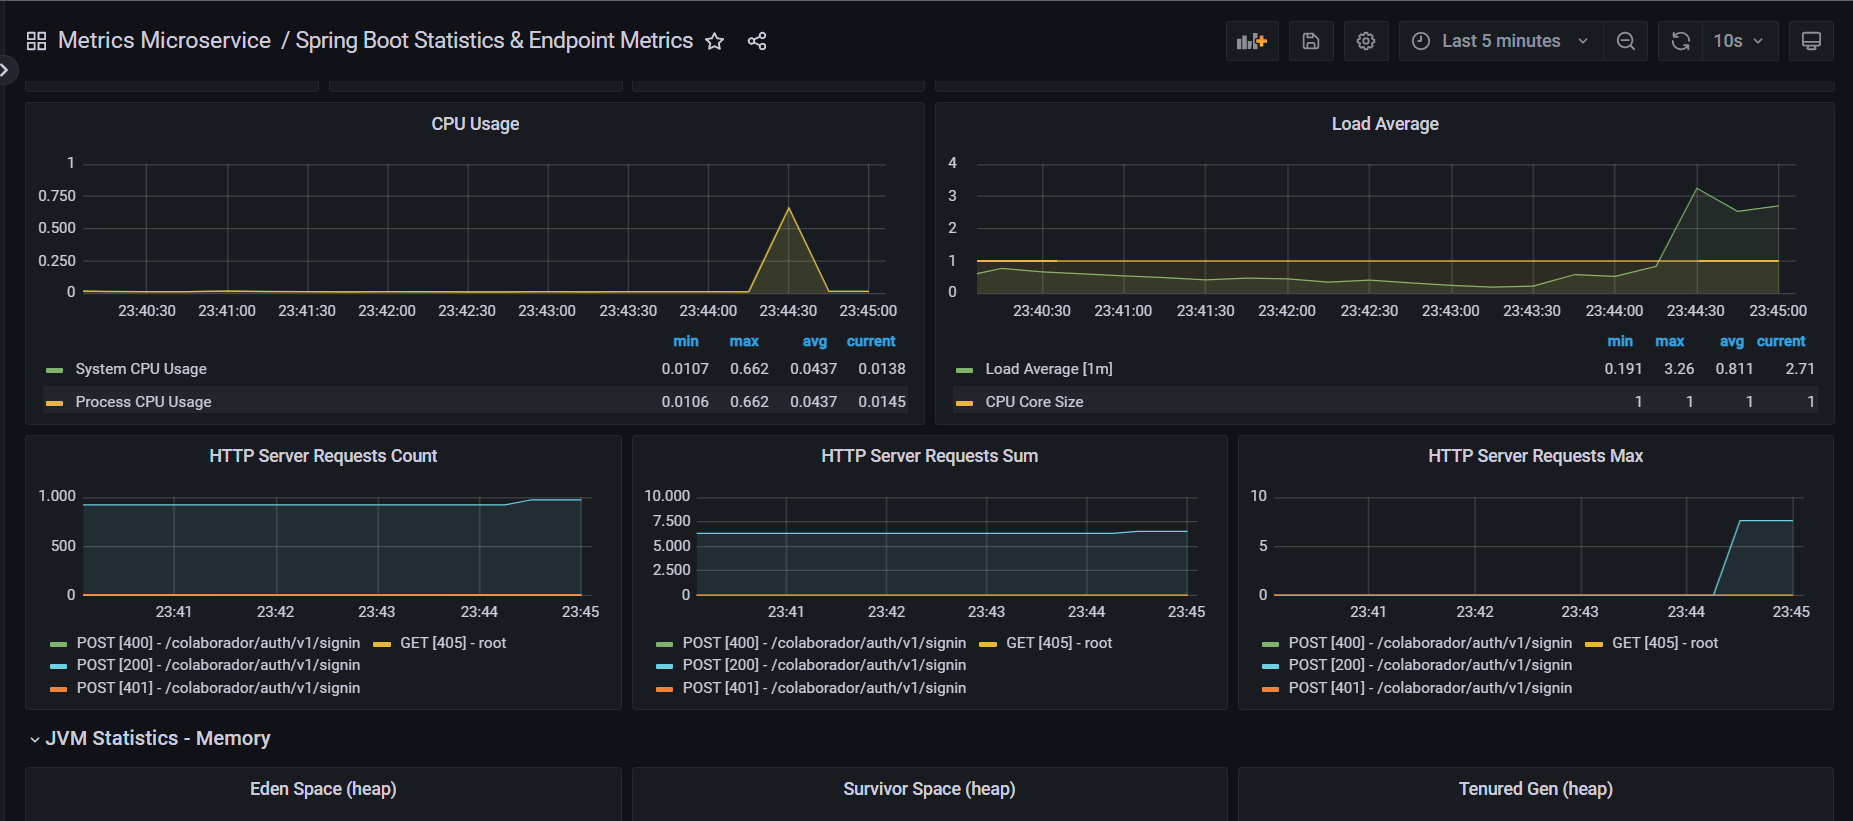
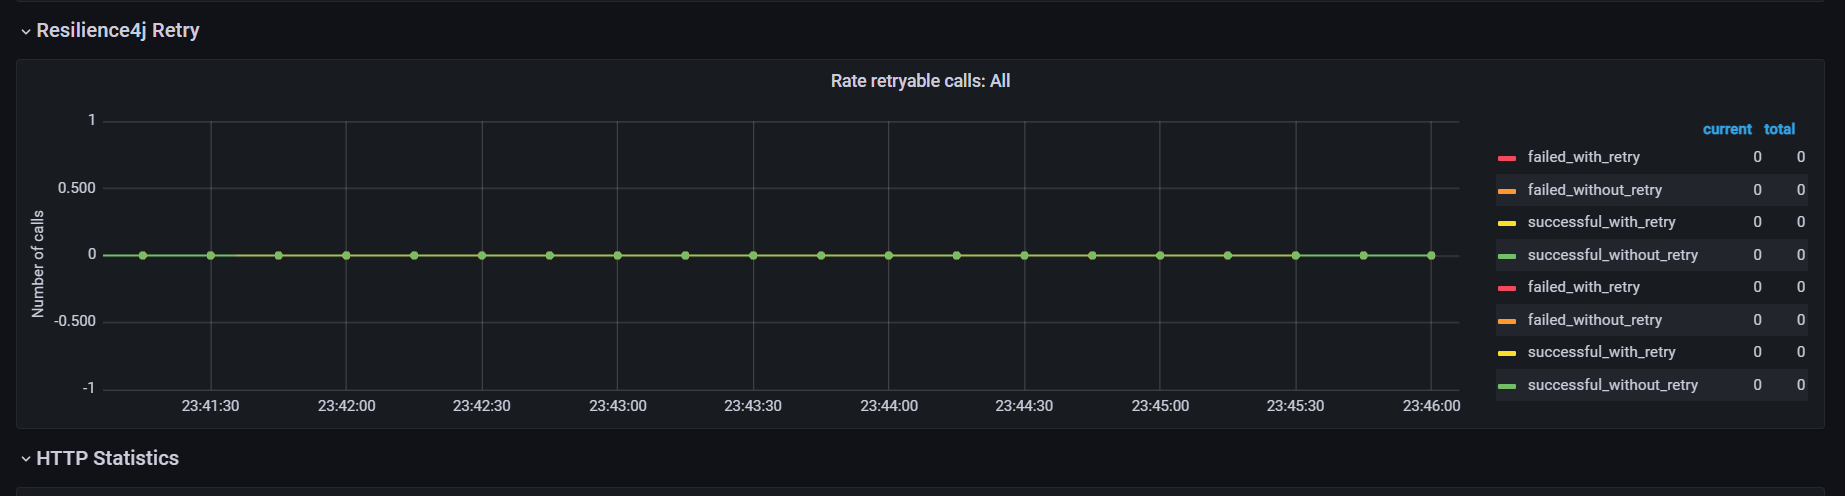
The Spring Boot Endpoint Metrics dashboard uses the prometheus data source to create a Grafana dashboard with the gauge, graph, piechart and stat panels.
Data source config
Collector type:
Collector plugins:
Collector config:
Revisions
Upload an updated version of an exported dashboard.json file from Grafana
| Revision | Description | Created | |
|---|---|---|---|
| Download |
Metrics Endpoint (Prometheus)
Easily monitor any Prometheus-compatible and publicly accessible metrics URL with Grafana Cloud's out-of-the-box monitoring solution.
Learn more