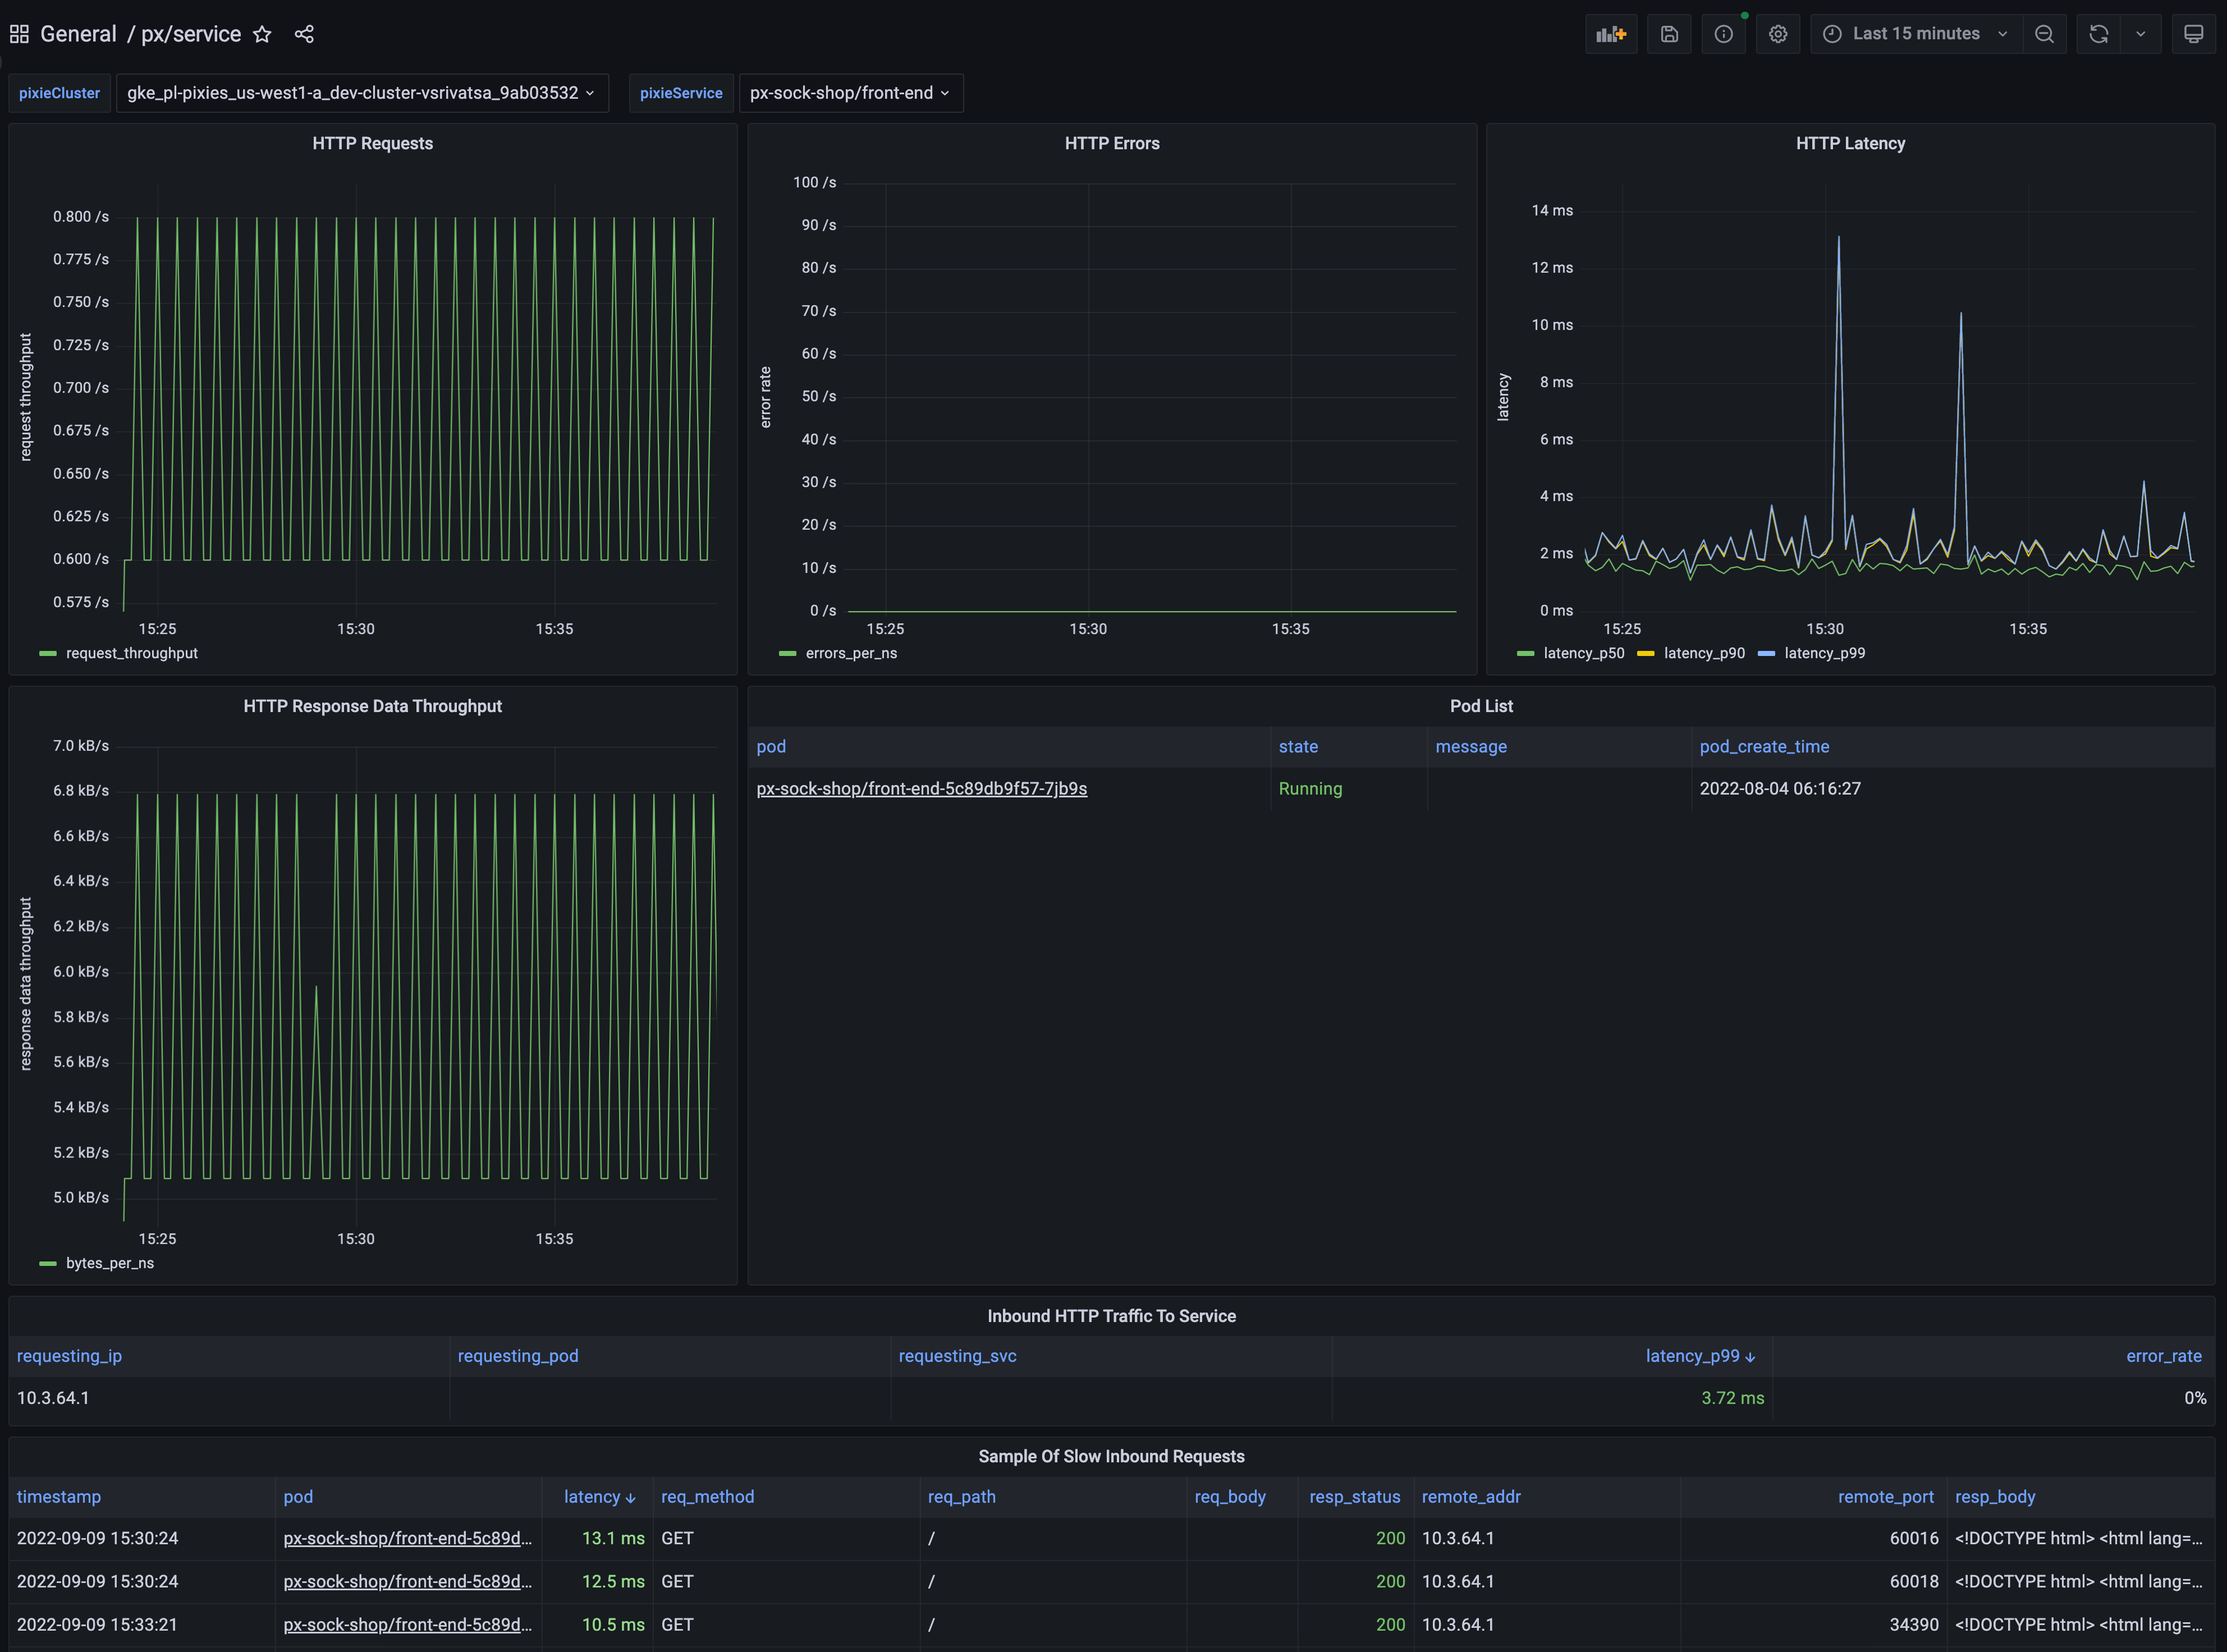
Pixie Service Overview
Dashboard shows latency, error, and throughput over time for all HTTP requests for the selected service. It also includes a sample of slow requests to the service.
To learn how to monitor service performance using Pixie, see the tutorial.
Data source config
Collector type:
Collector plugins:
Collector config:
Revisions
Upload an updated version of an exported dashboard.json file from Grafana
| Revision | Description | Created | |
|---|---|---|---|
| Download |