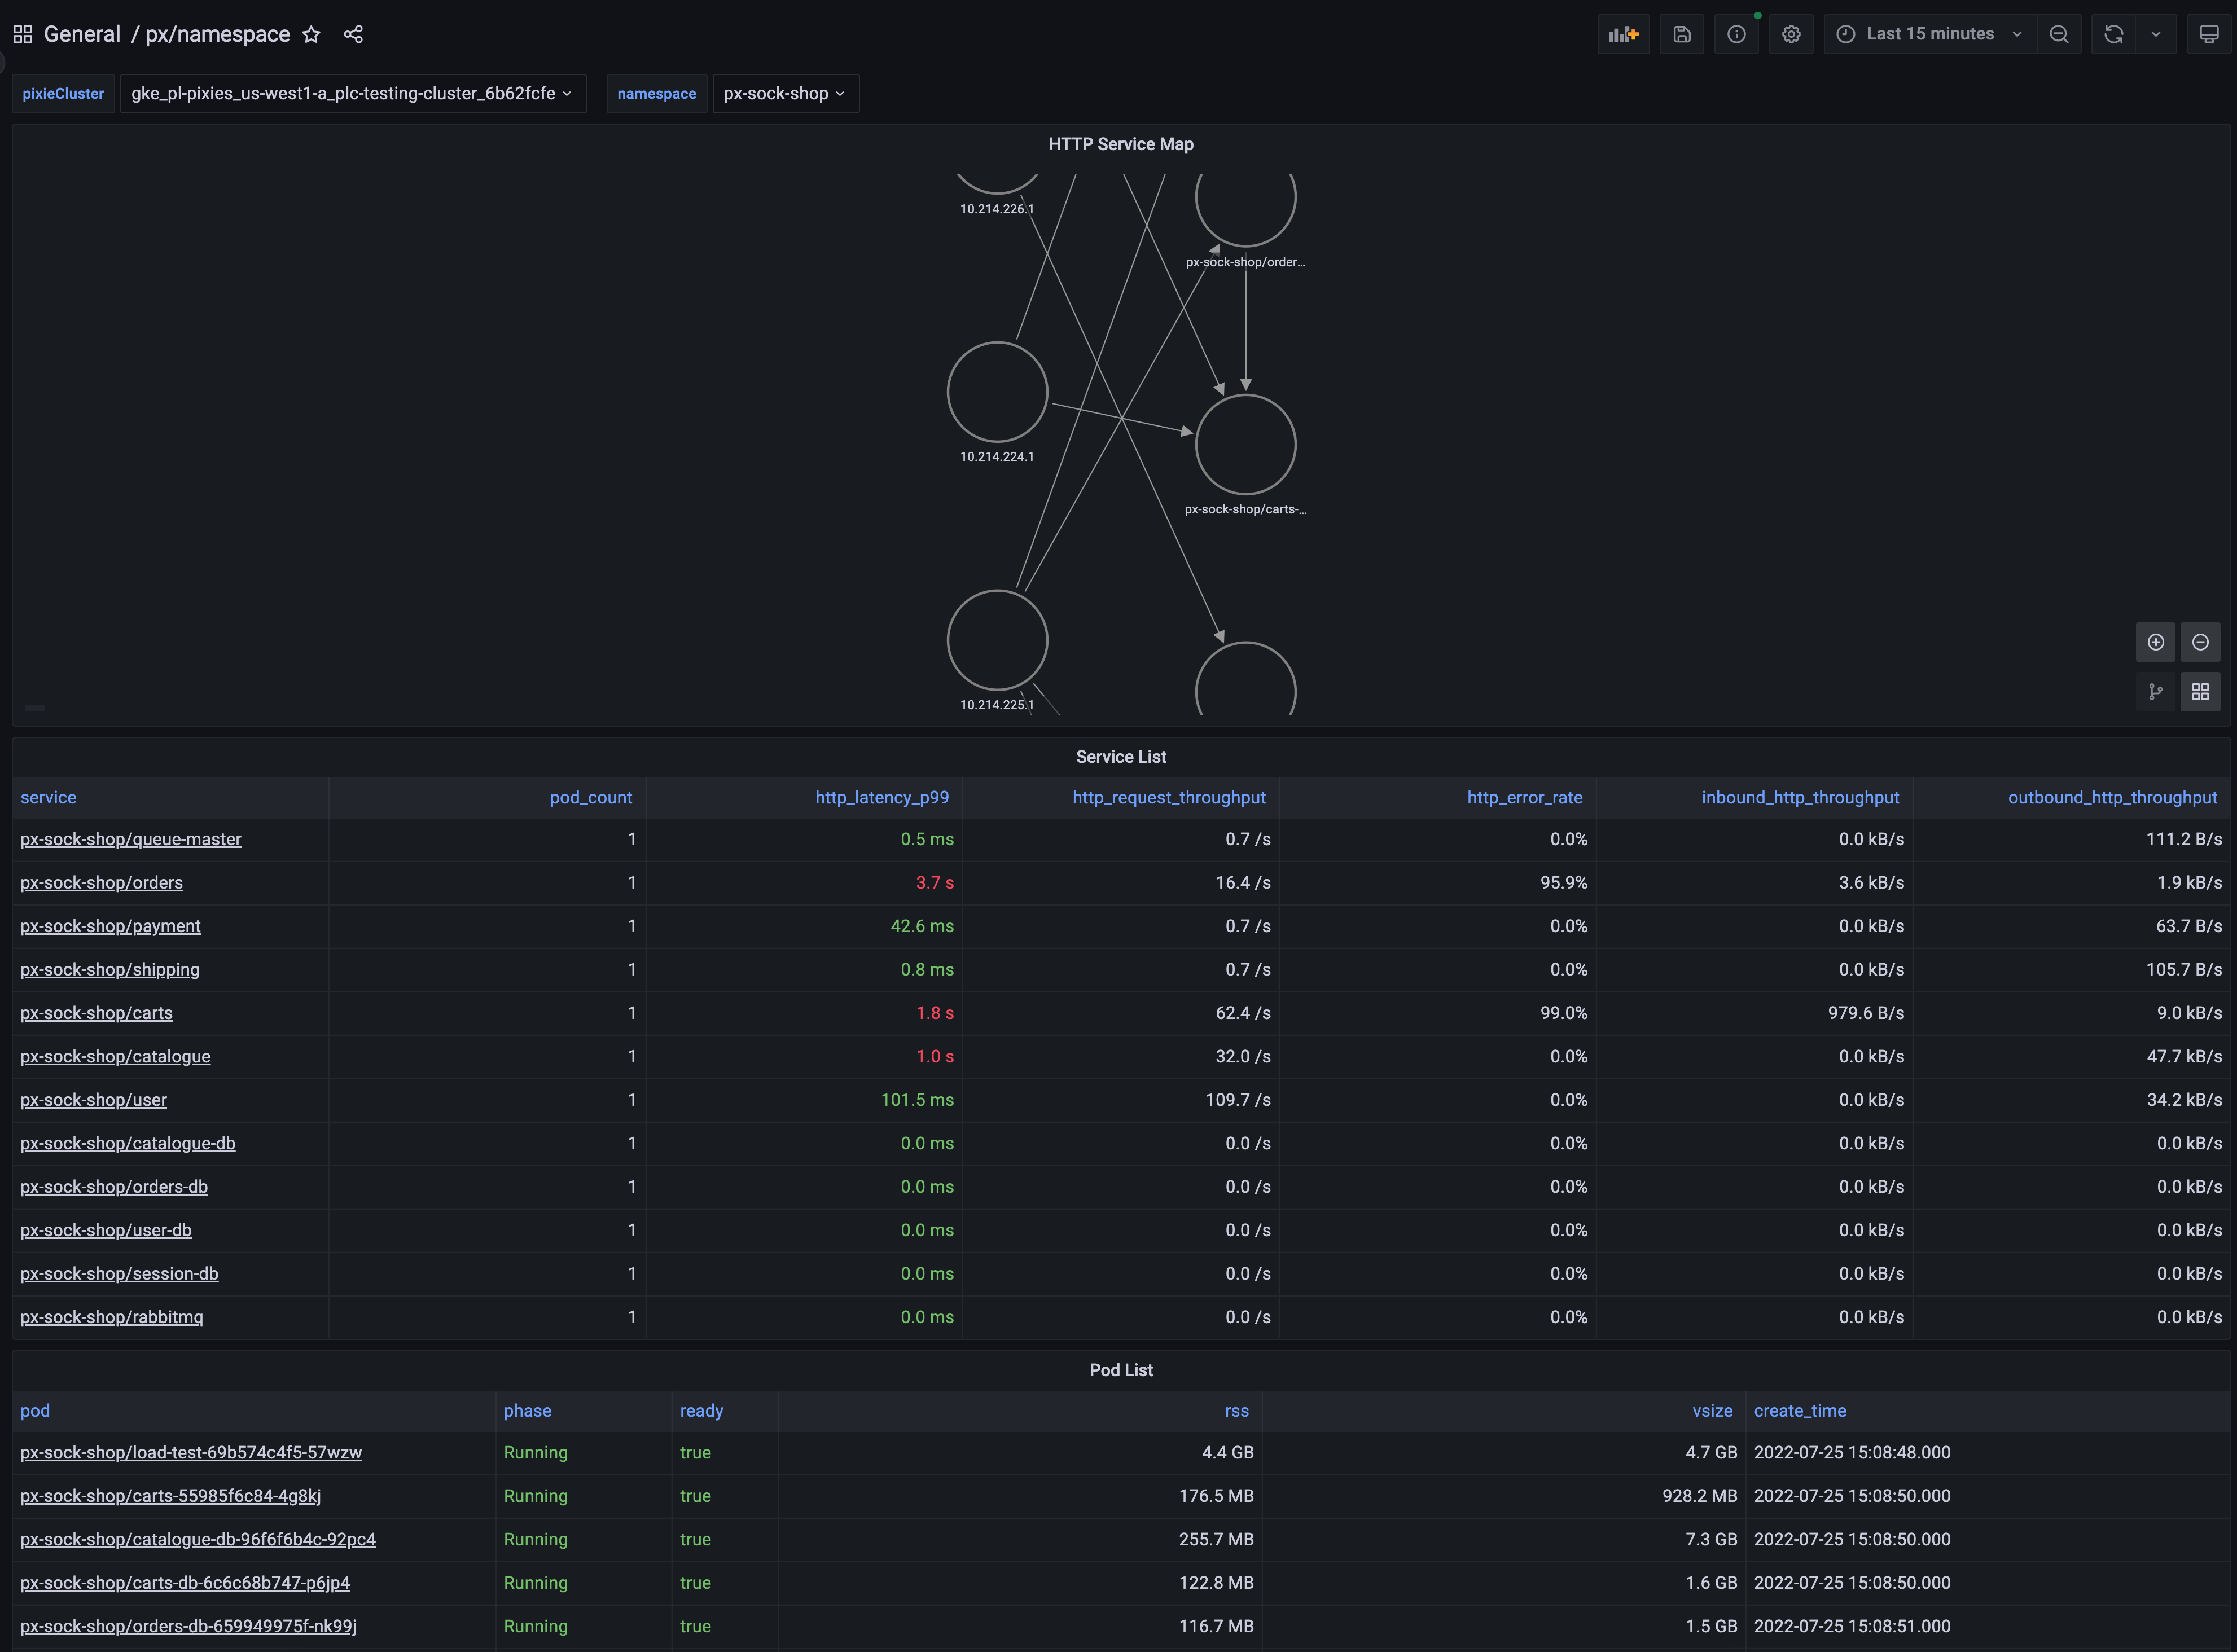
Pixie Namespace Overview
Dashboard includes a service map of the HTTP traffic between the services in the selected namspace, along with the latency, error rate, and throughput per service. It also lists pods available in the namespace.
To learn how to monitor service performance and infrastructure health using Pixie, see the tutorial.
Data source config
Collector type:
Collector plugins:
Collector config:
Revisions
Upload an updated version of an exported dashboard.json file from Grafana
| Revision | Description | Created | |
|---|---|---|---|
| Download |