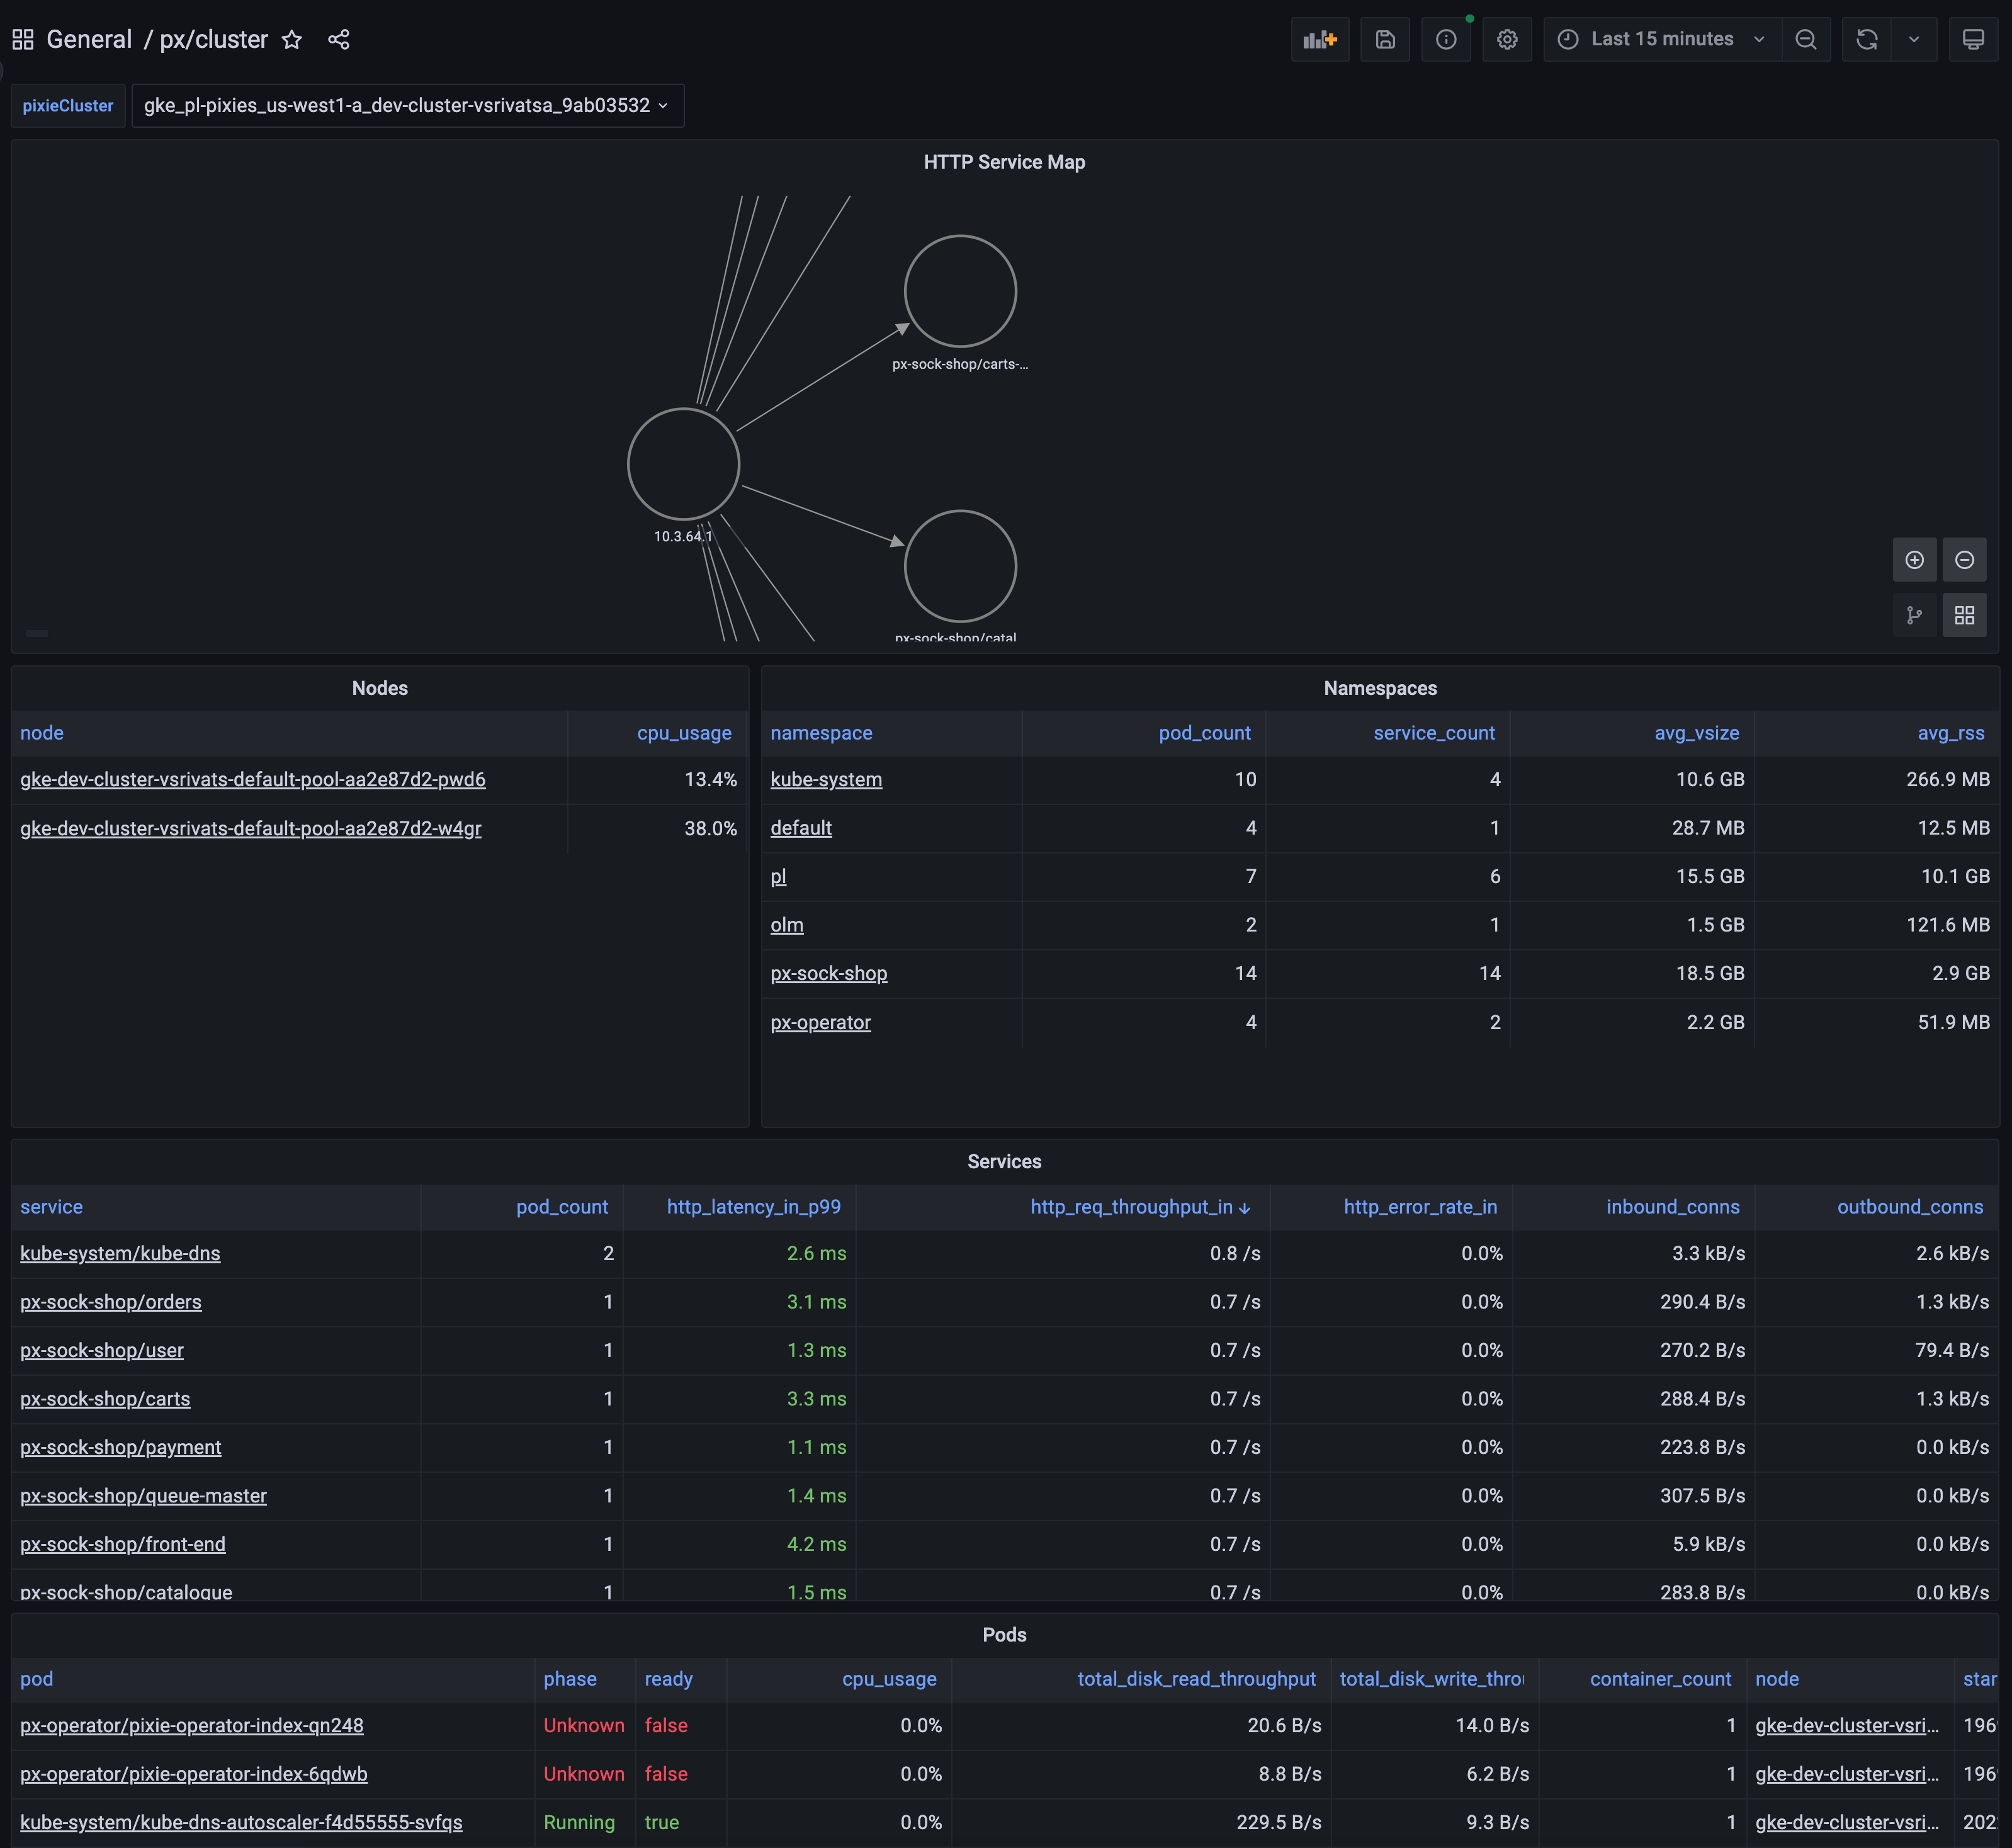
Pixie K8s Cluster Overview
Dashboard includes a service map of the HTTP traffic between the services in your cluster, along with the latency, error rate, and throughput per service. It also lists the nodes, namespaces and pods available in your cluster.
To learn how to monitor service performance and infrastructure health using Pixie, see the tutorial.
Data source config
Collector type:
Collector plugins:
Collector config:
Revisions
Upload an updated version of an exported dashboard.json file from Grafana
| Revision | Description | Created | |
|---|---|---|---|
| Download |
Kubernetes
Monitor your Kubernetes deployment with prebuilt visualizations that allow you to drill down from a high-level cluster overview to pod-specific details in minutes.
Learn more