pfSense
Dashboard for Prometheus node_exporter on pfSense (FreeBSD)
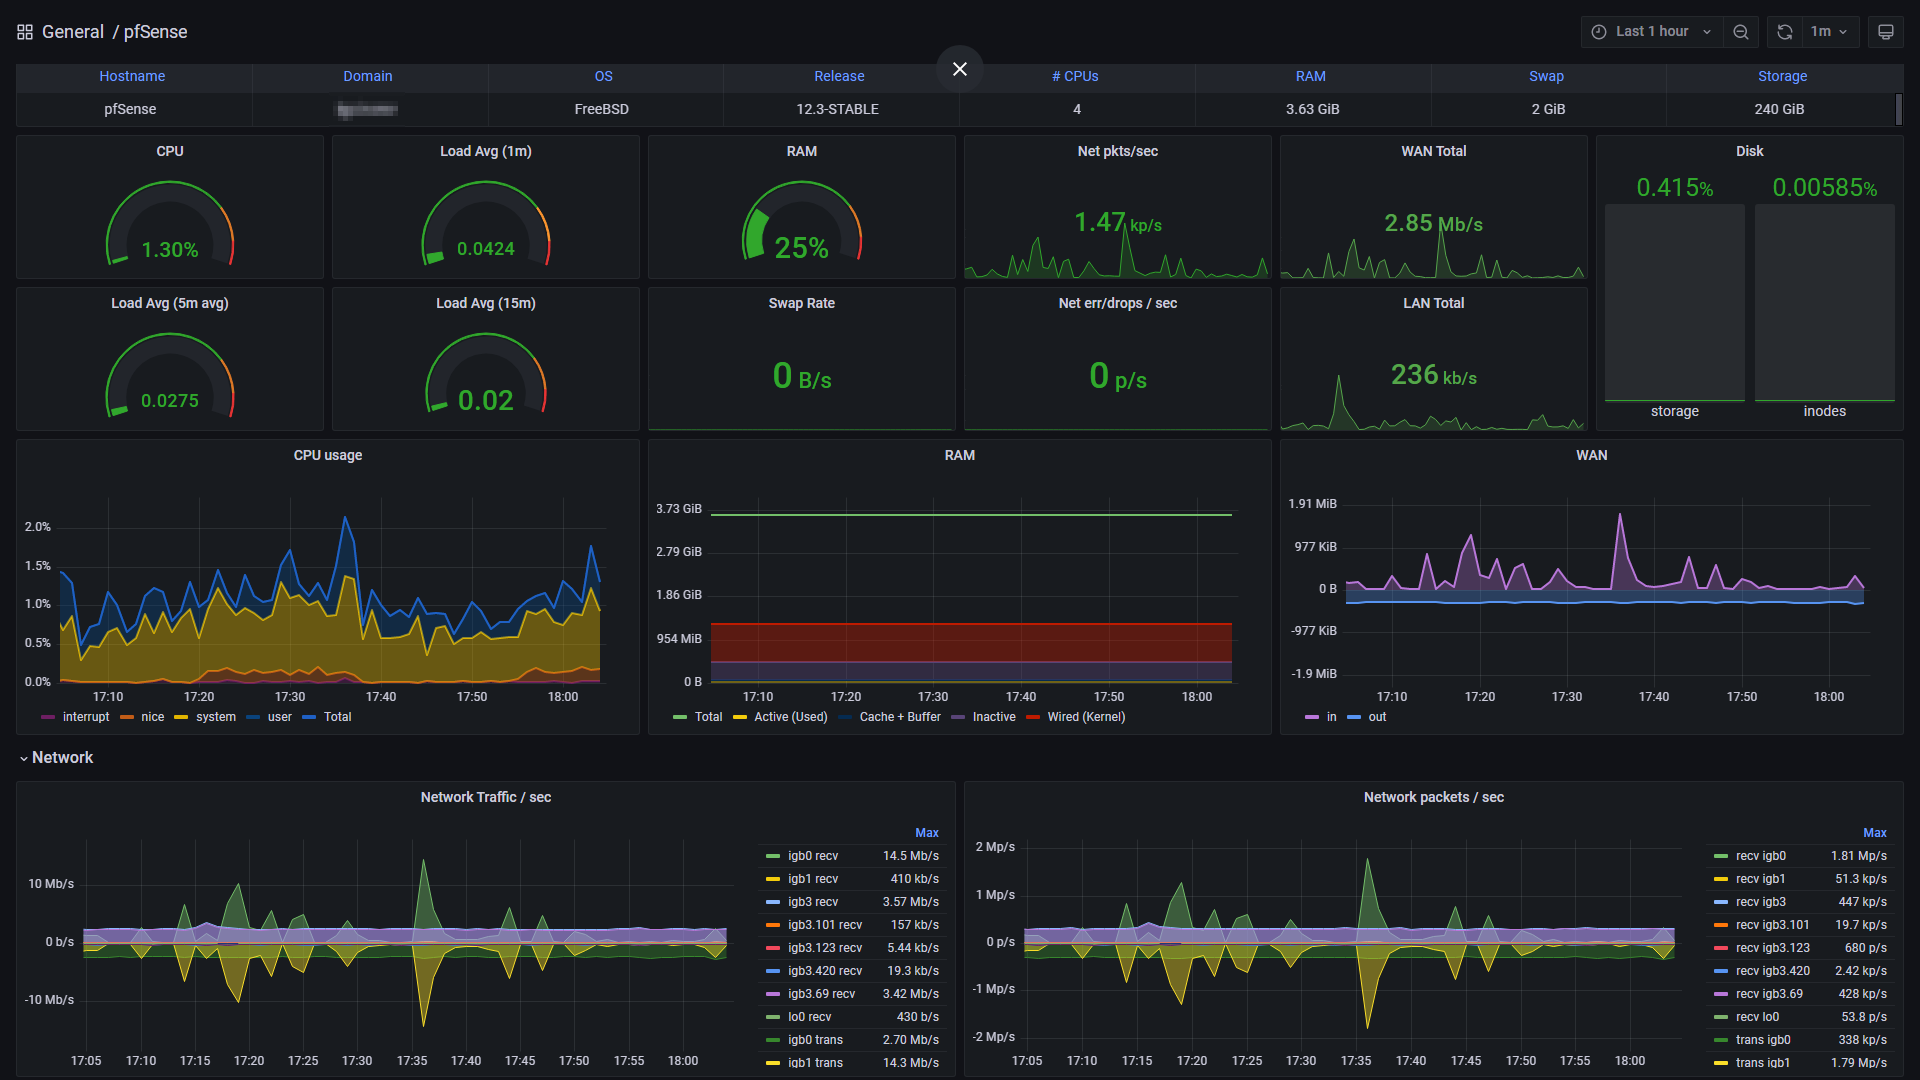
pfSense node_exporter Dashboard based on error5's pfSense dashboard (ID: 11491)
Select the Job, Host and WAN interface of your pfSense instance from the variables and the dashboard counters for LAN/WAN should auto-adjust.
Interval controls both gauge intervals and minimum interval for graphs.
LAN traffic is calculated as sum of all Physical Interface Traffic after subtracting WAN Traffic divided by two (2). Final calculation is divided by two to represent the data rate through the firewall, rather than the total data rate of both the sending and receiving interfaces.
This should work on pfSense firewalls utilizing Intel NICs, as well as Netgate Appliances (SG series, etc.) and VMware VMs. Other appliances which use 3-4 letter physical interface names are likely to work as well.
Tested on: pfSense 2.6.0 / node_exporter 0.18.1 using a a 4x Intel NIC + Celeron CPU appliance
Data source config
Collector config:
Upload an updated version of an exported dashboard.json file from Grafana
| Revision | Description | Created | |
|---|---|---|---|
| Download |