Multiple OpenWRT infrastructure
A dashborad for VPN infrastructure composed of multiple OpenWRT devices.
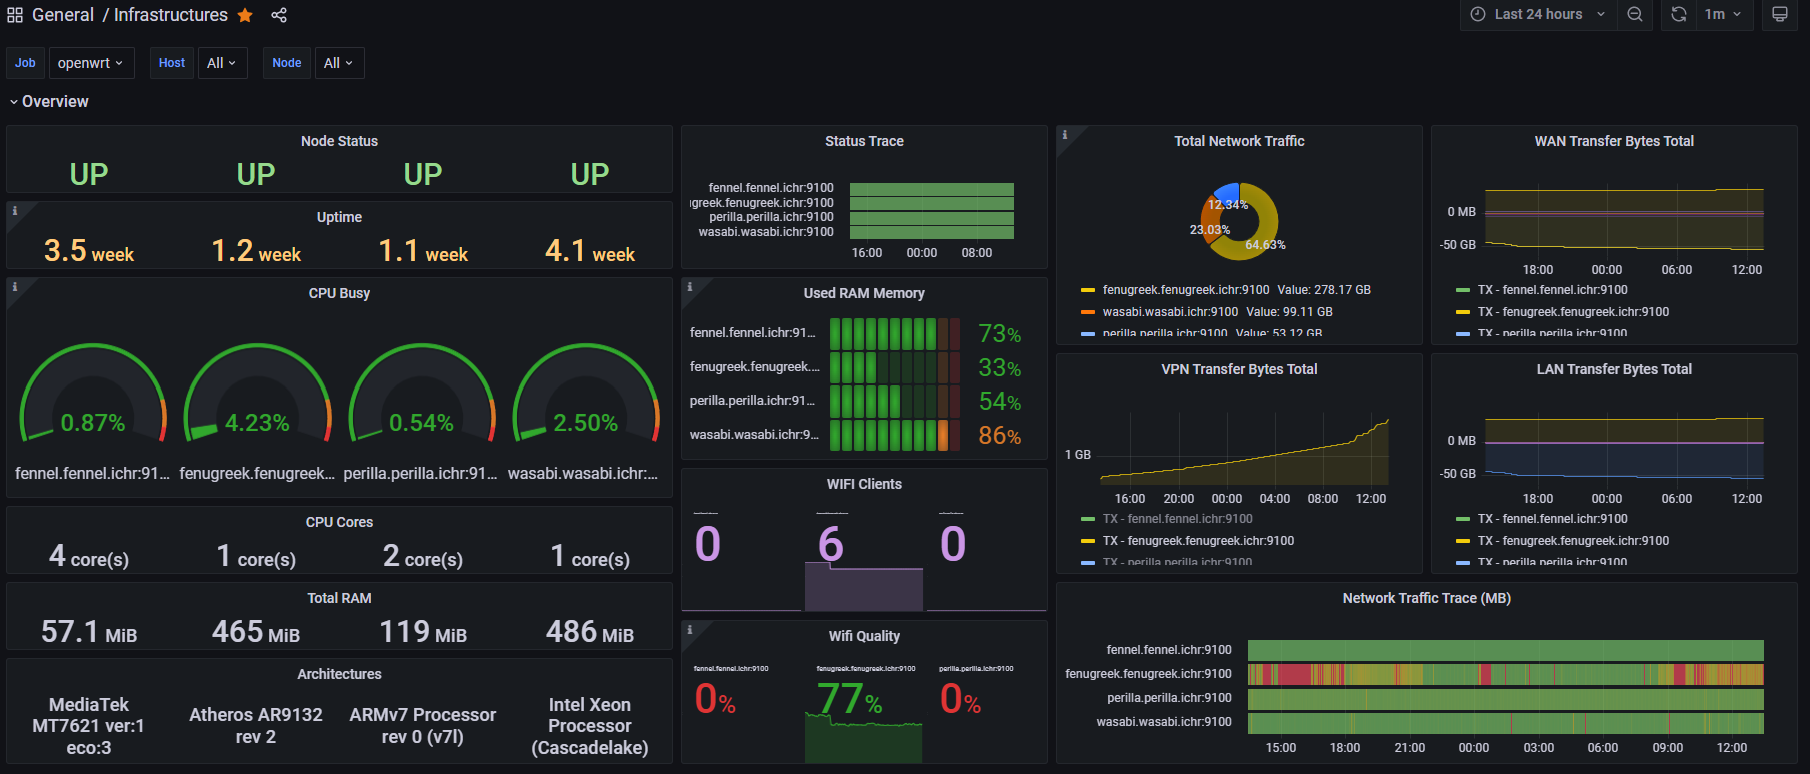
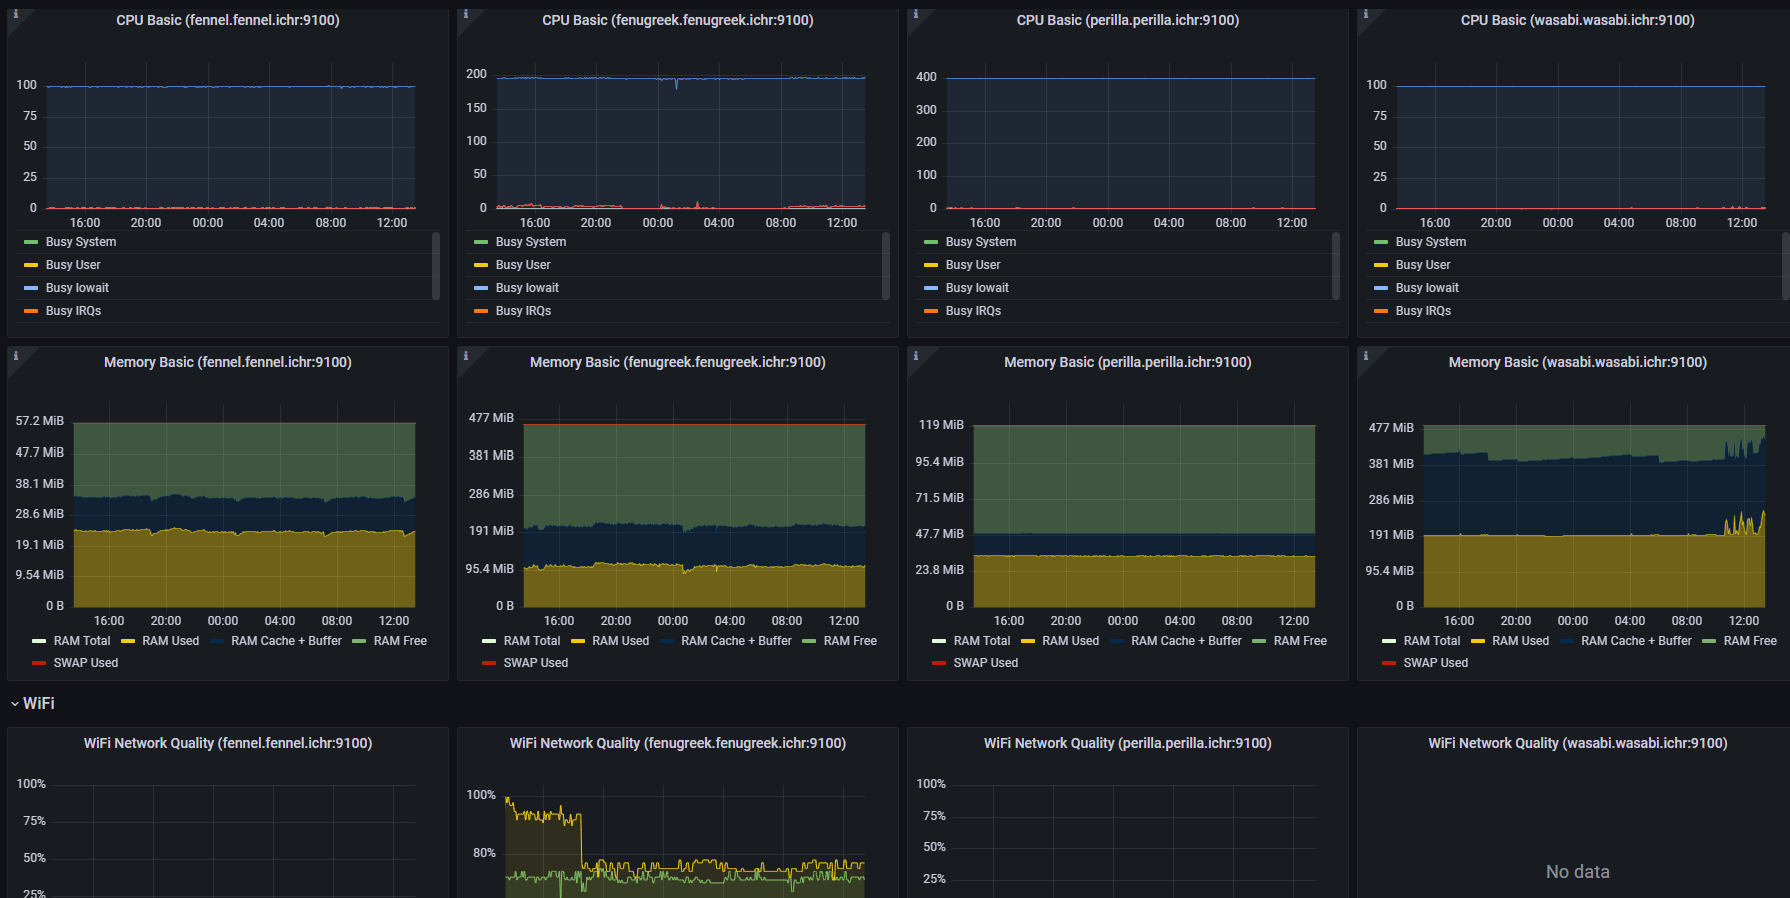
The Multiple OpenWRT infrastructure dashboard uses the prometheus data source to create a Grafana dashboard with the bargauge, gauge, piechart, stat, state-timeline and timeseries panels.
Data source config
Collector type:
Collector plugins:
Collector config:
Revisions
Upload an updated version of an exported dashboard.json file from Grafana
| Revision | Description | Created | |
|---|---|---|---|
| Download |
Splunk Infrastructure Monitoring
With the Grafana plugin for Splunk Infrastructure Monitoring, you can quickly visualize your metrics and analytics in Grafana.
Learn more