DNScollector - Dashboard for Prometheus
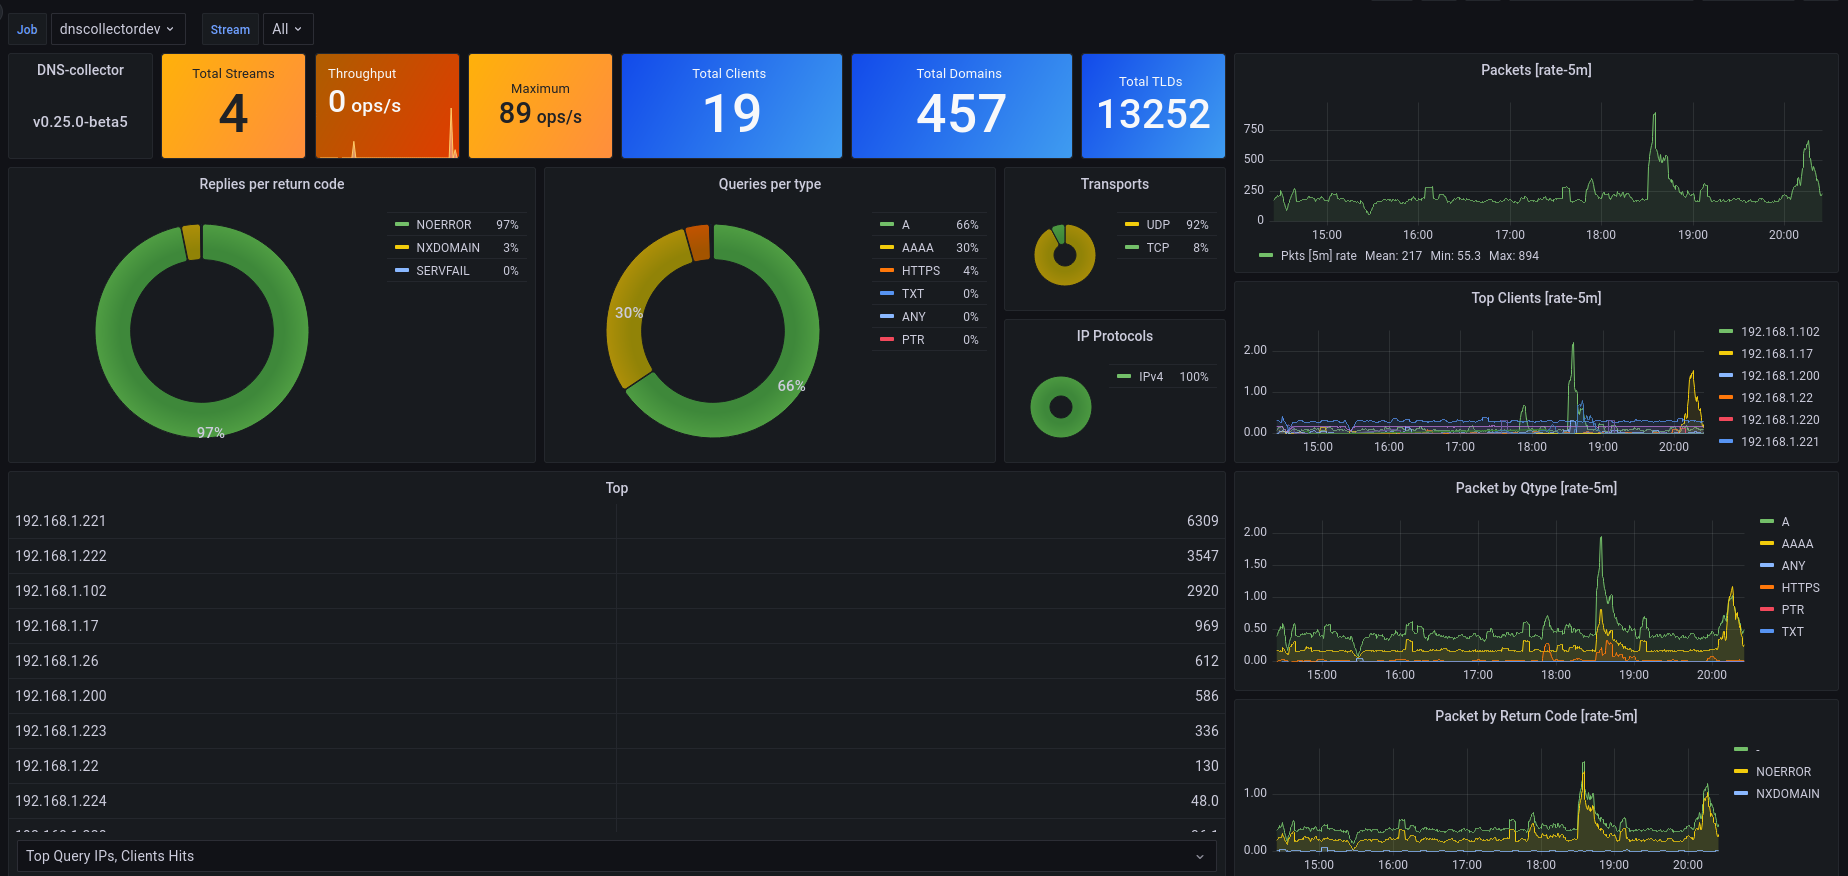
This dashboard enable to collect some metrics about your DNS server. Based on metrics exported by the https://github.com/dmachard/go-dnscollector.
Data source config
Collector type:
Collector plugins:
Collector config:
Revisions
Upload an updated version of an exported dashboard.json file from Grafana
| Revision | Description | Created | |
|---|---|---|---|
| Download |
Metrics Endpoint (Prometheus)
Easily monitor any Prometheus-compatible and publicly accessible metrics URL with Grafana Cloud's out-of-the-box monitoring solution.
Learn more