Vertica Performance Dashboard
Performance metrics for Vertica.
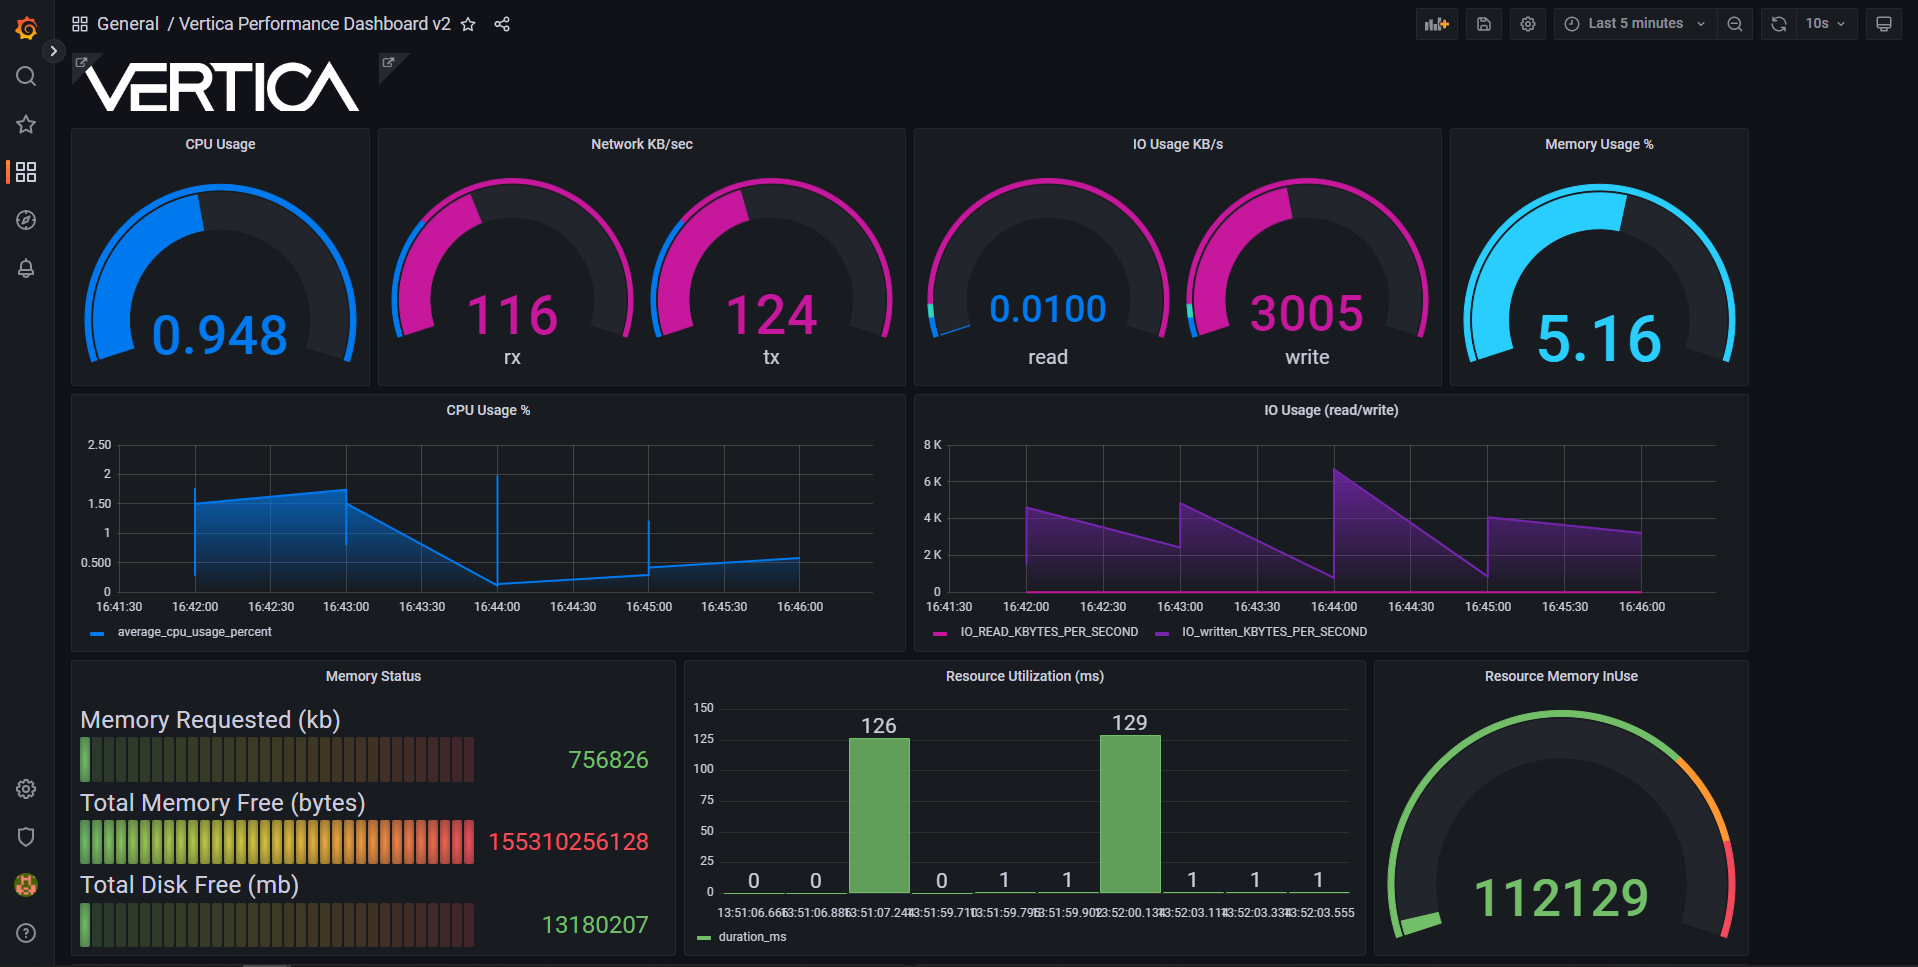
This dashboard uses the Vertica plugin for Grafana and visualizes the following data:
- CPU Usage
- Network received and transmitted in KB/sec
- IO usage in KB/sec
- Memory usage in %
- CPU usage in %
- IO Read and Write % sec
- Memory Status
- Resource Utilization (ms)
- Resource Memory InUse
- Memory Usage in %
- Network Received and Transmitted per sec
- Last 10 error messages
- Last 10 SQL statements executed
- Last 10 Queries Requested and its duration
- Event Status
Additional Vertica dashboards
These Vertica dashboards use Prometheus as a data source:
Data source config
Collector type:
Collector plugins:
Collector config:
Revisions
Upload an updated version of an exported dashboard.json file from Grafana
| Revision | Description | Created | |
|---|---|---|---|
| Download |