EKS cost
EKS cost visualization.
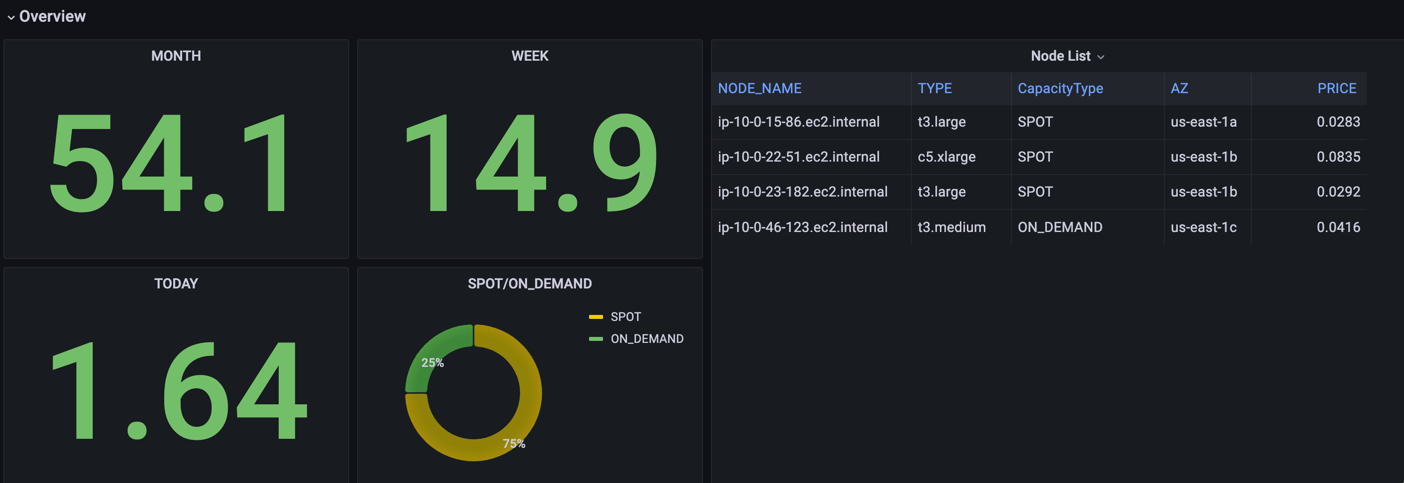
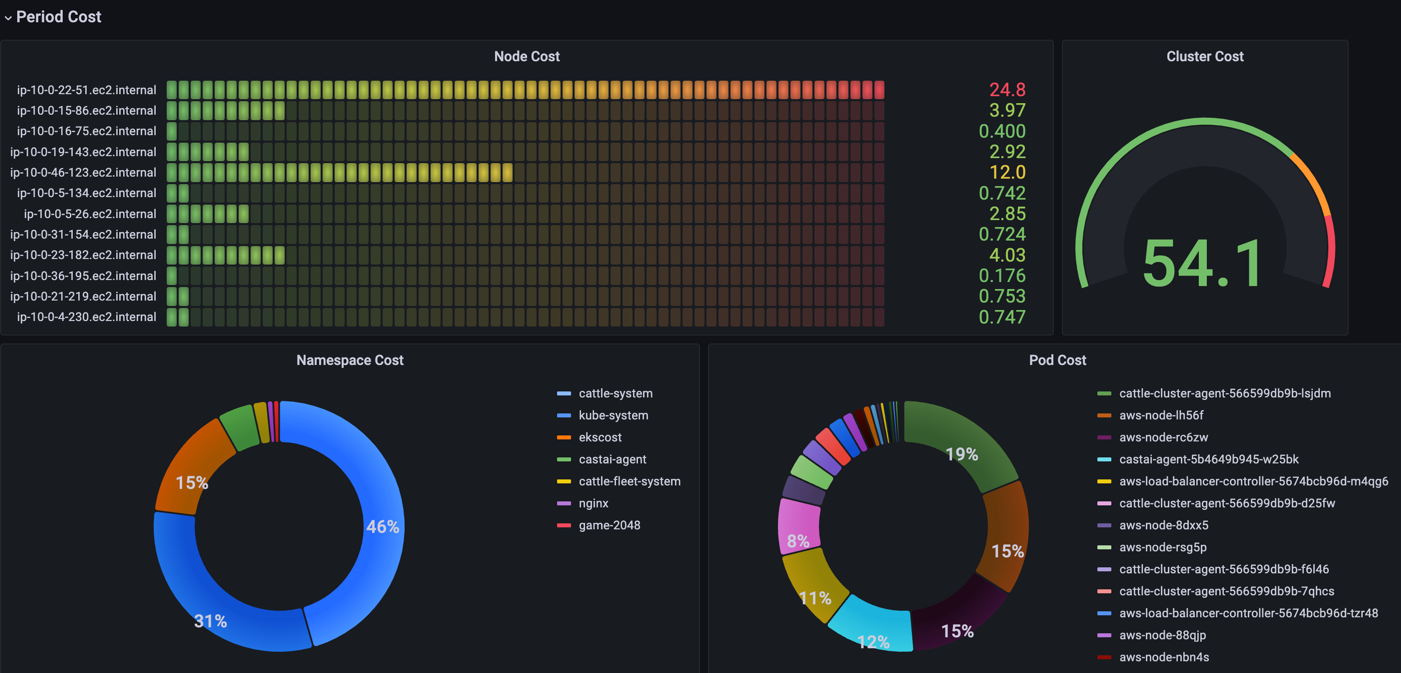
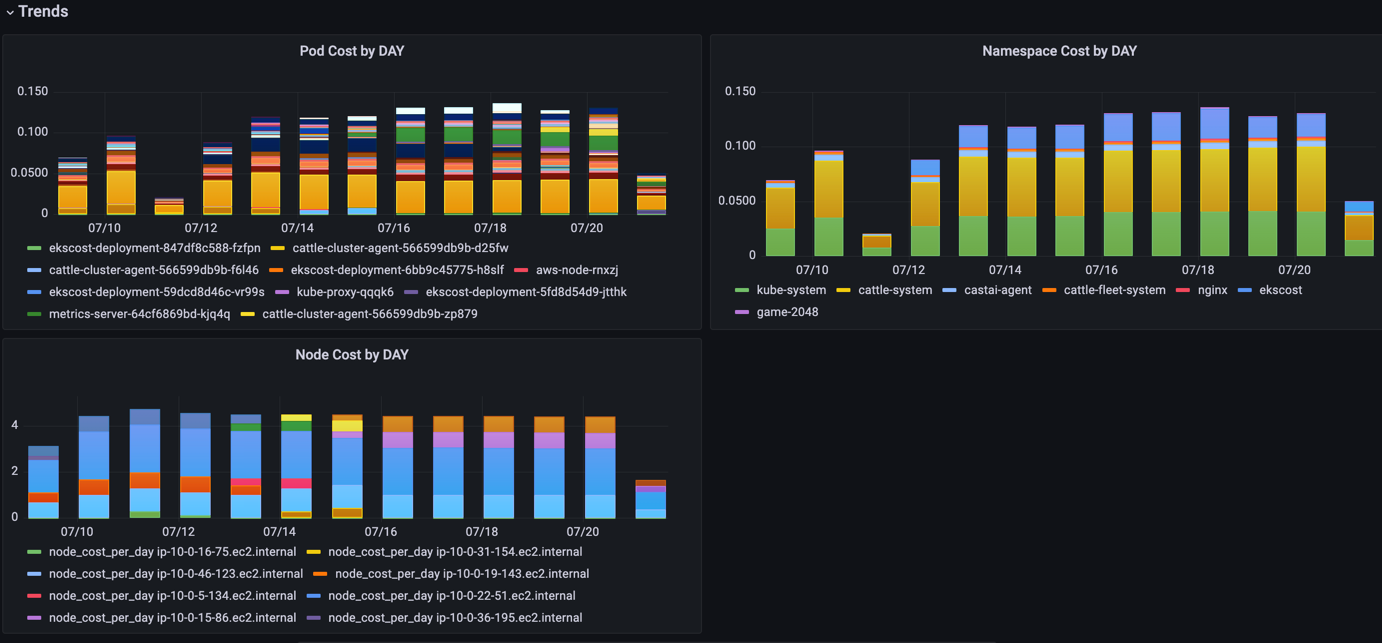
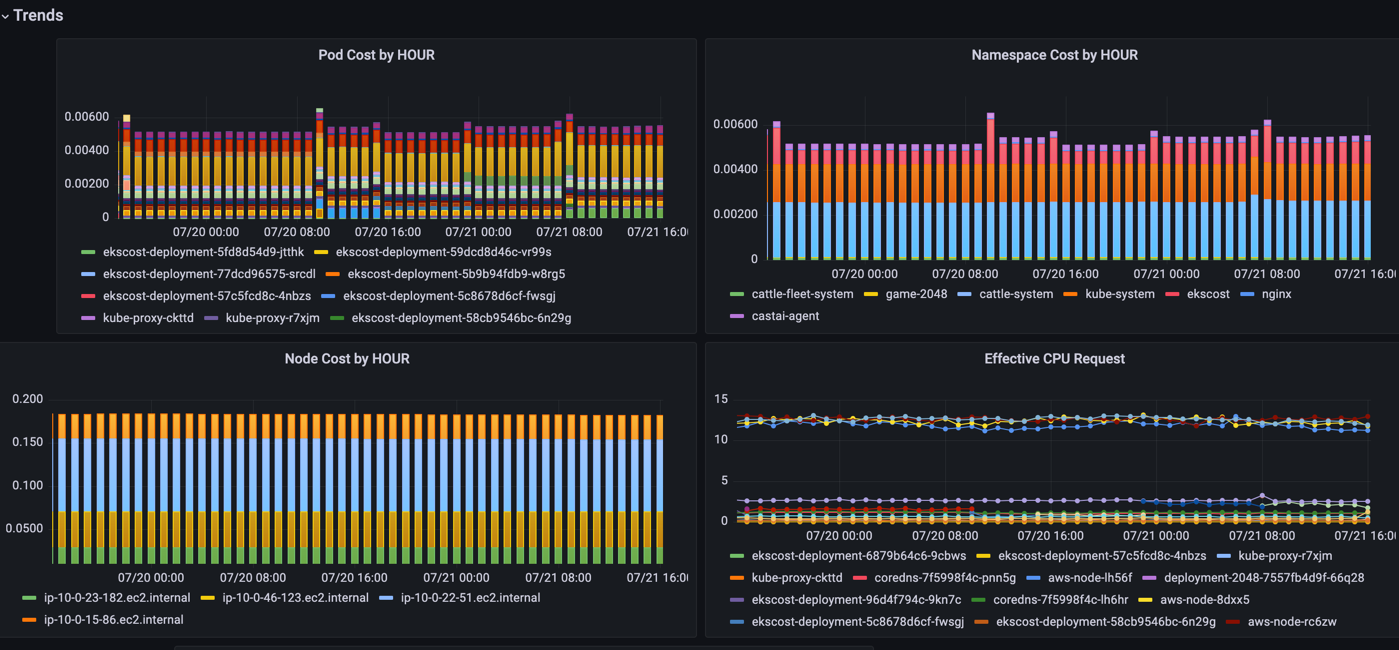
The EKS cost dashboard uses the grafana-timestream-datasource data source to create a Grafana dashboard with the bargauge, gauge, piechart, stat, table and timeseries panels.
Data source config
Collector type:
Collector plugins:
Collector config:
Revisions
Upload an updated version of an exported dashboard.json file from Grafana
| Revision | Description | Created | |
|---|---|---|---|
| Download |