Freebox Monitoring
This is a pretty simple dashboard for Freebox Monitoring using https://github.com/saphoooo/freebox_exporter It only uses fiber informations, but you can tweak it to use DSL.
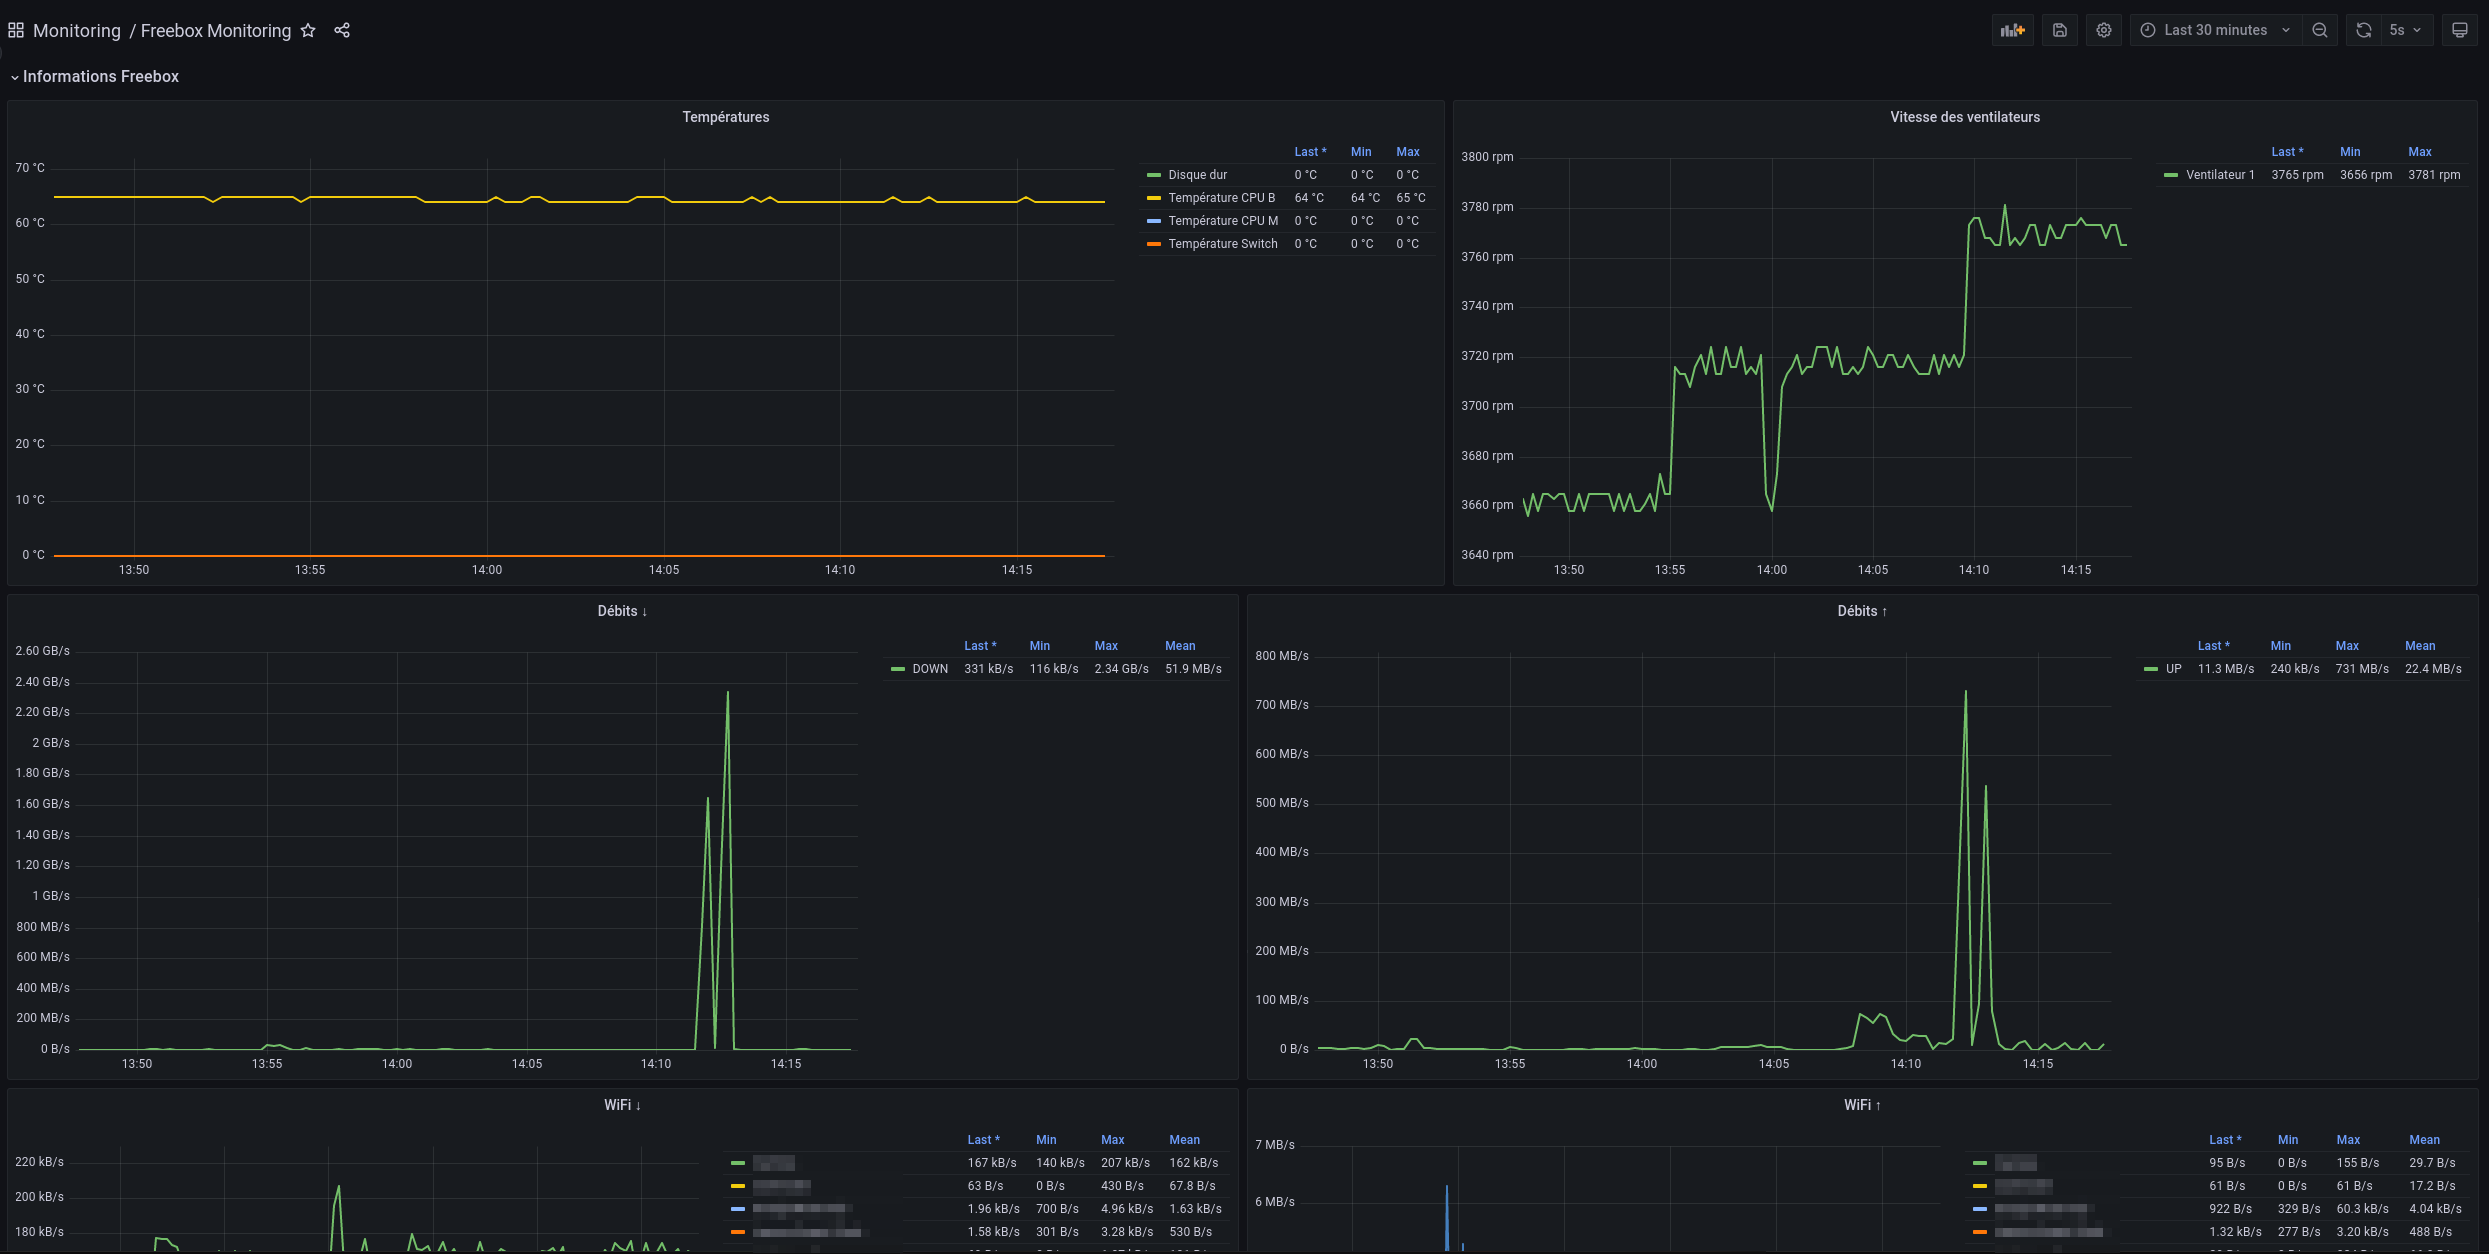
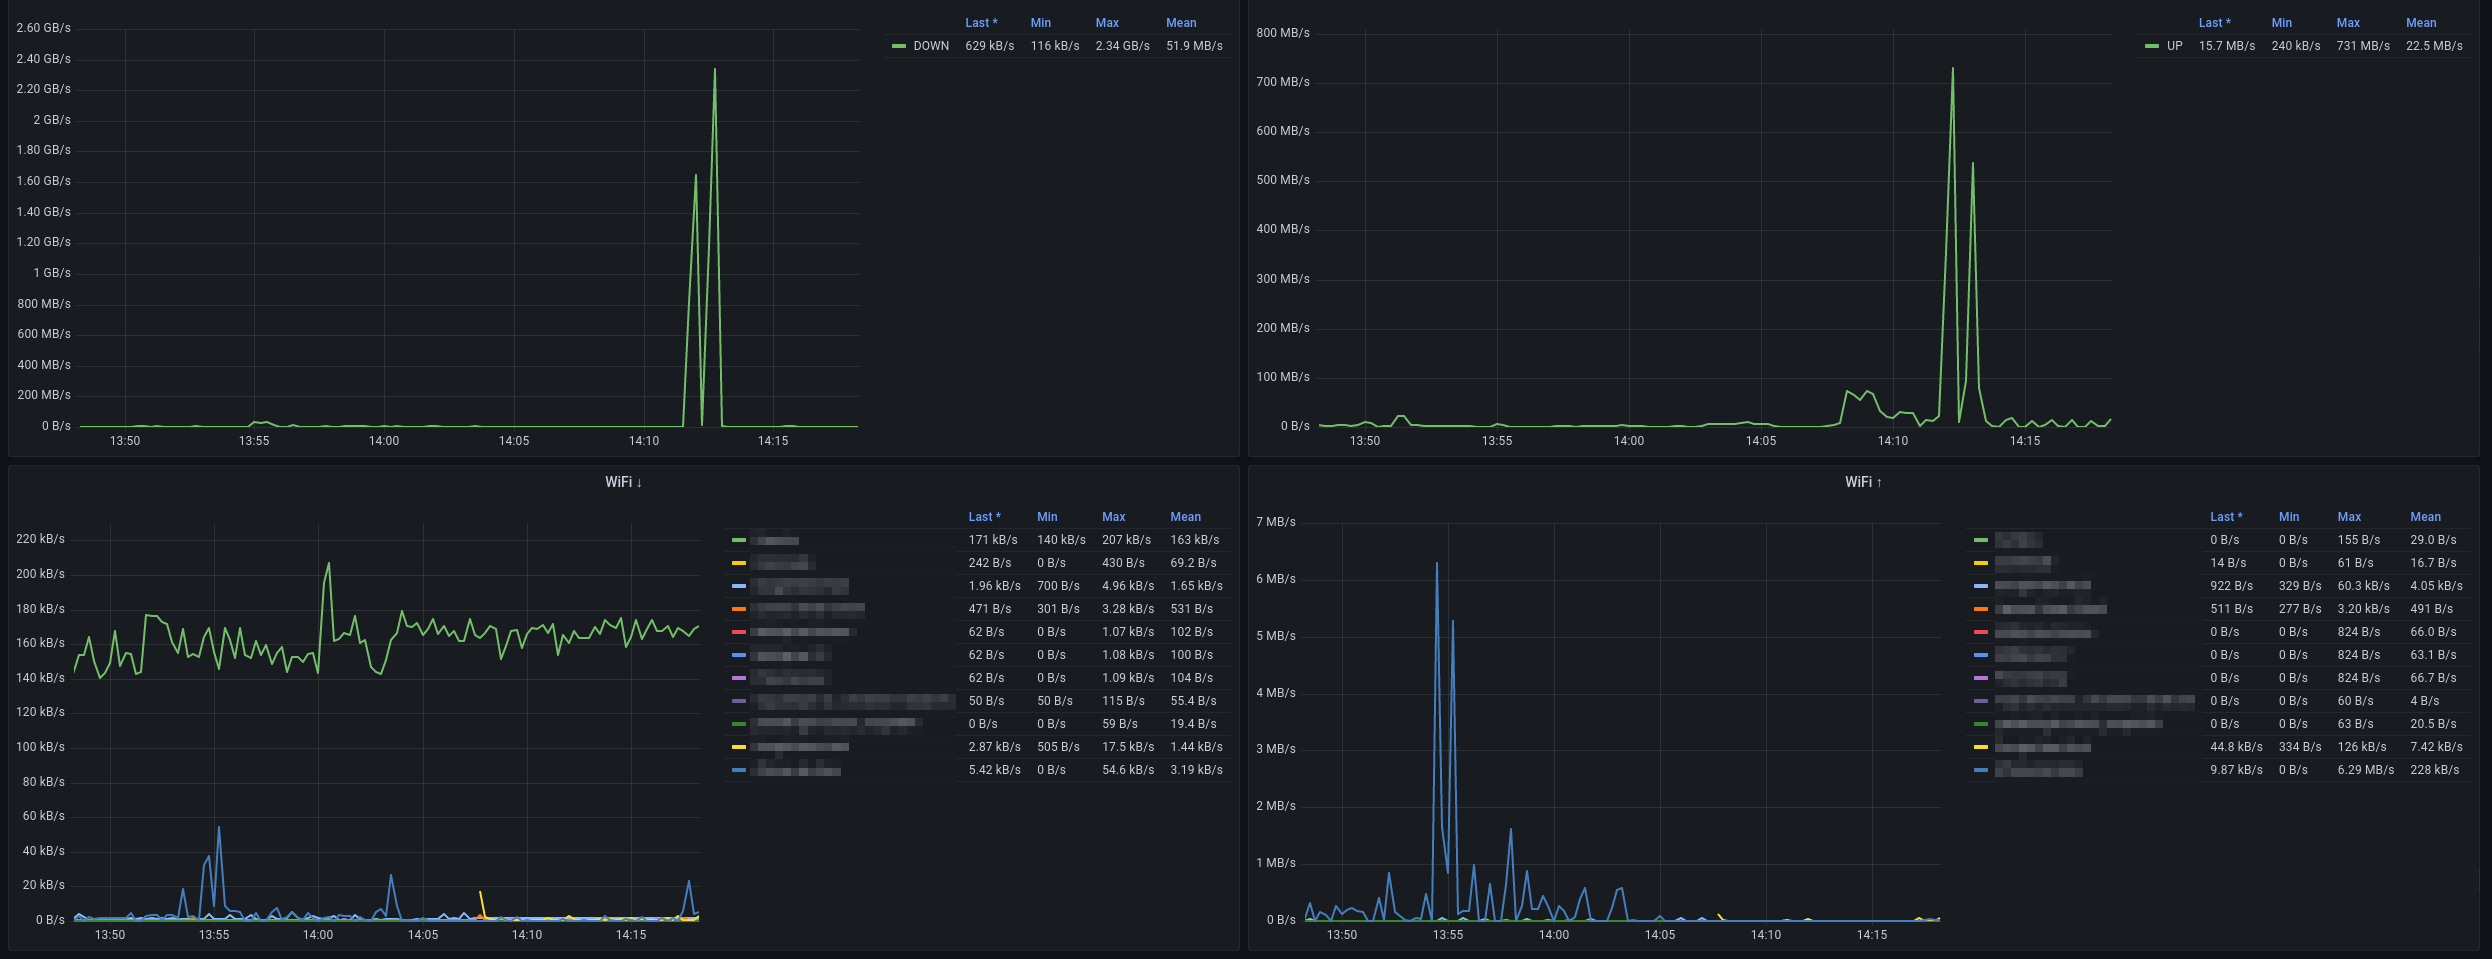
The Freebox Monitoring dashboard uses the prometheus data source to create a Grafana dashboard with the timeseries panel.
Data source config
Collector type:
Collector plugins:
Collector config:
Revisions
Upload an updated version of an exported dashboard.json file from Grafana
| Revision | Description | Created | |
|---|---|---|---|
| Download |