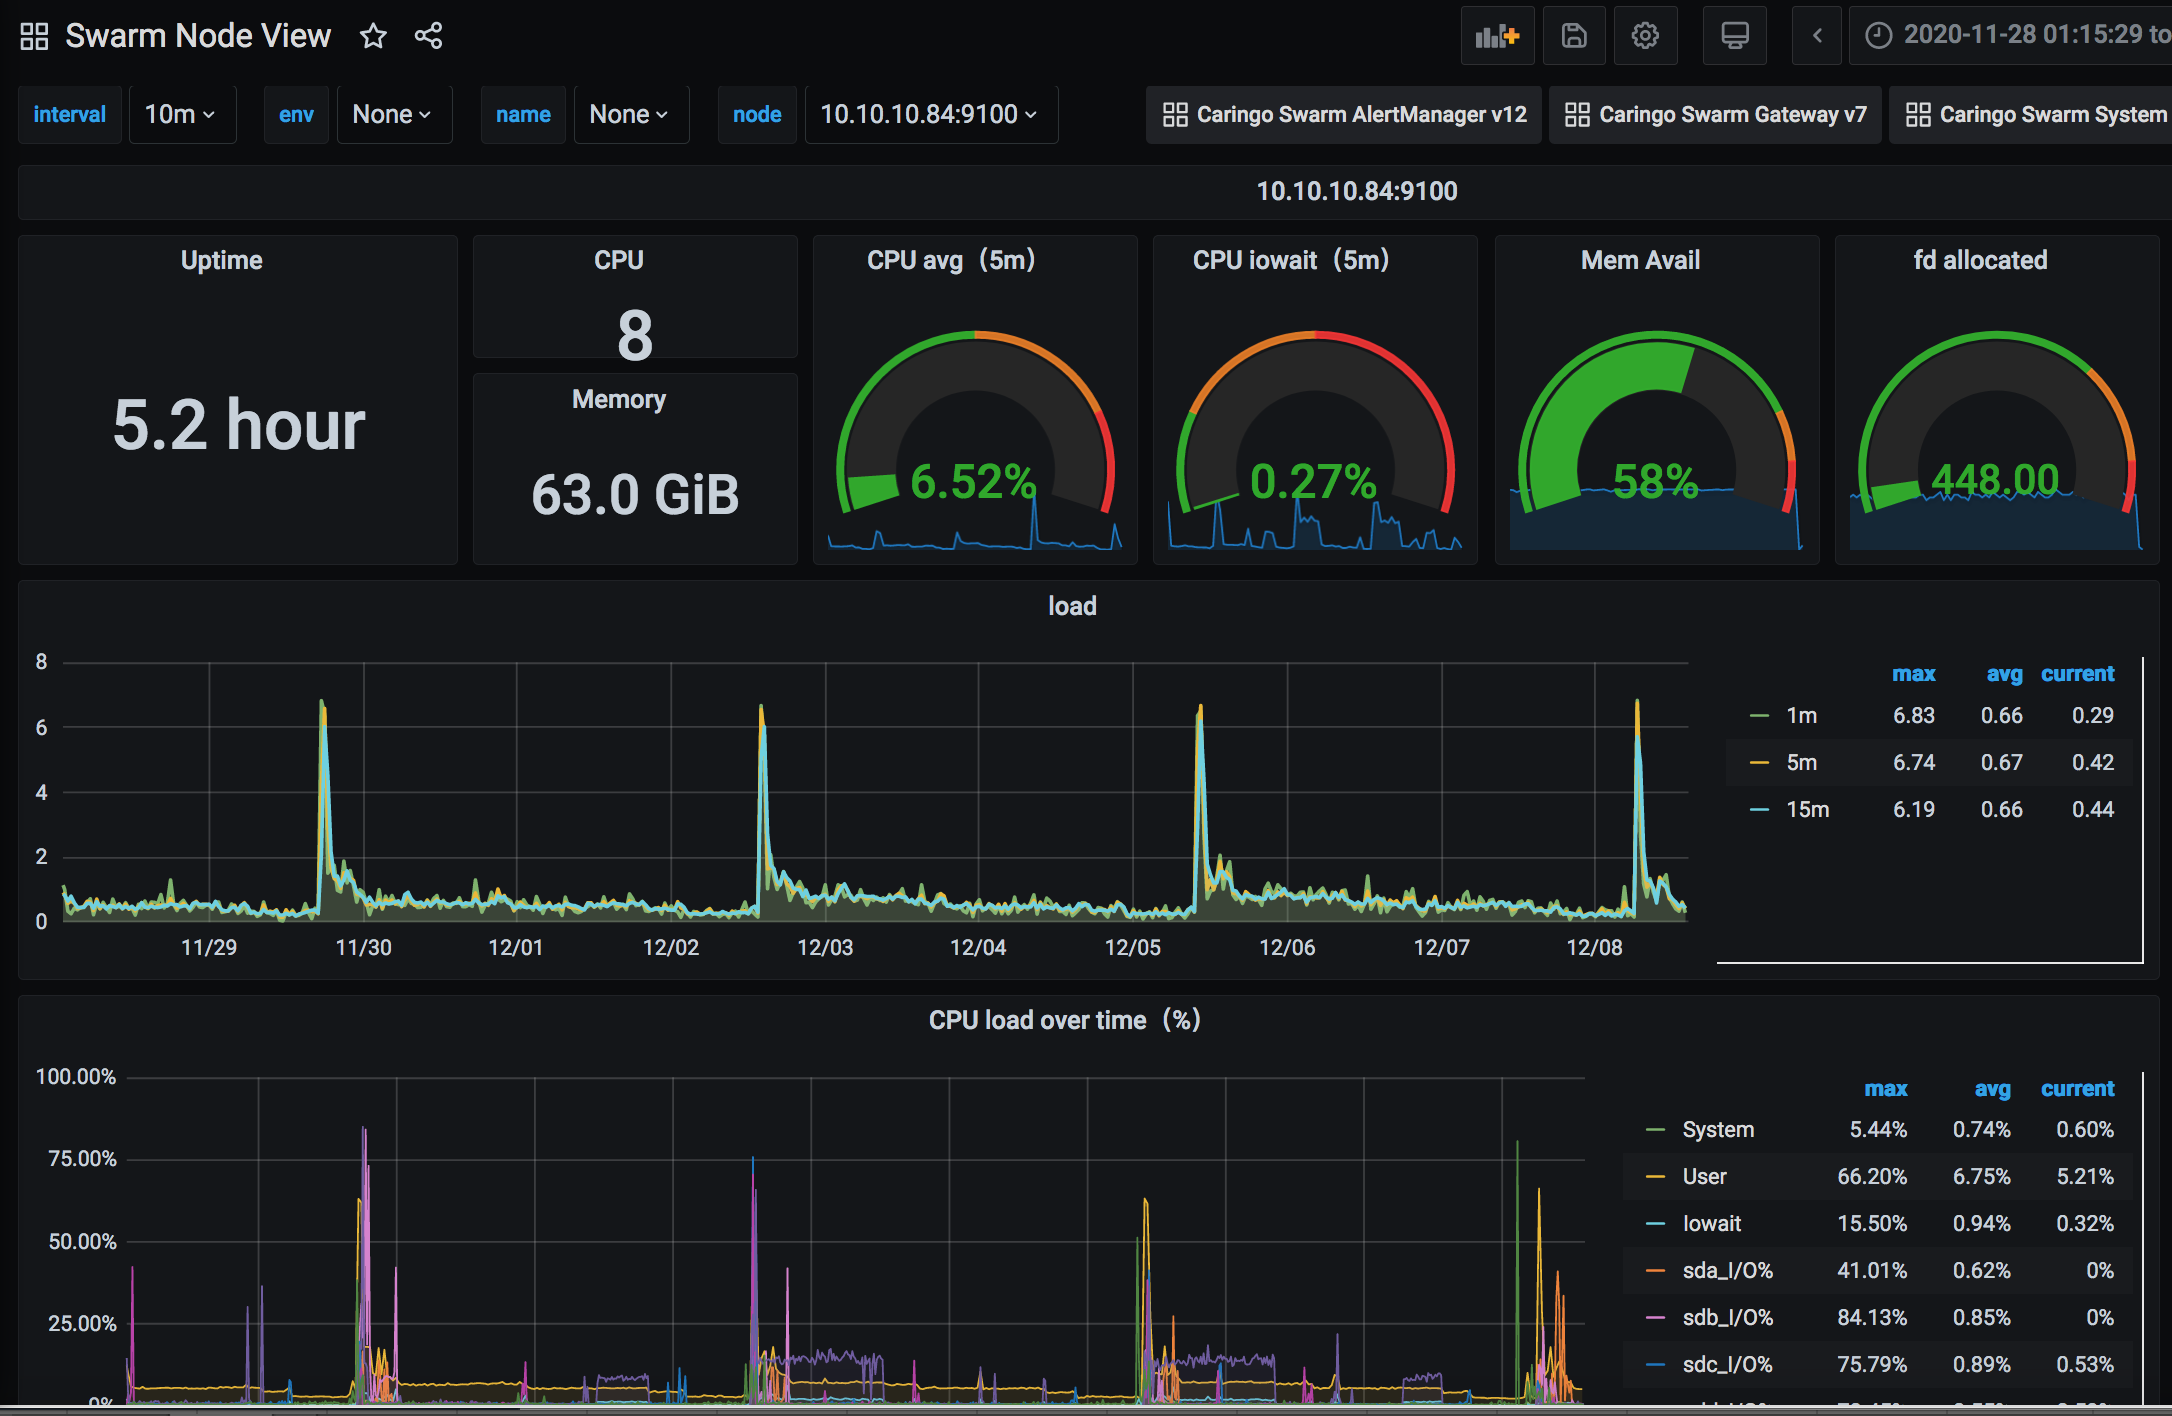
DataCore Swarm Node View
Swarm dashboard to see servers running node_exporter service, contains enhanced panels for swarm software as well.
This dashboard is an example of how to visualize host metrics provided by DataCore Swarm v12 and above. See DataCore Swarm documentation on instructions for enabling Swarm metrics
Data source config
Collector type:
Collector plugins:
Collector config:
Revisions
Upload an updated version of an exported dashboard.json file from Grafana
| Revision | Description | Created | |
|---|---|---|---|
| Download |
Linux Server
Monitor Linux with Grafana. Easily monitor your Linux deployment with Grafana Cloud's out-of-the-box monitoring solution.
Learn more