Redis Server Overview With Telegraf
A Redis Server Performance Monitoring Redis Server with Prometheus and telegraf agent using Redis agent
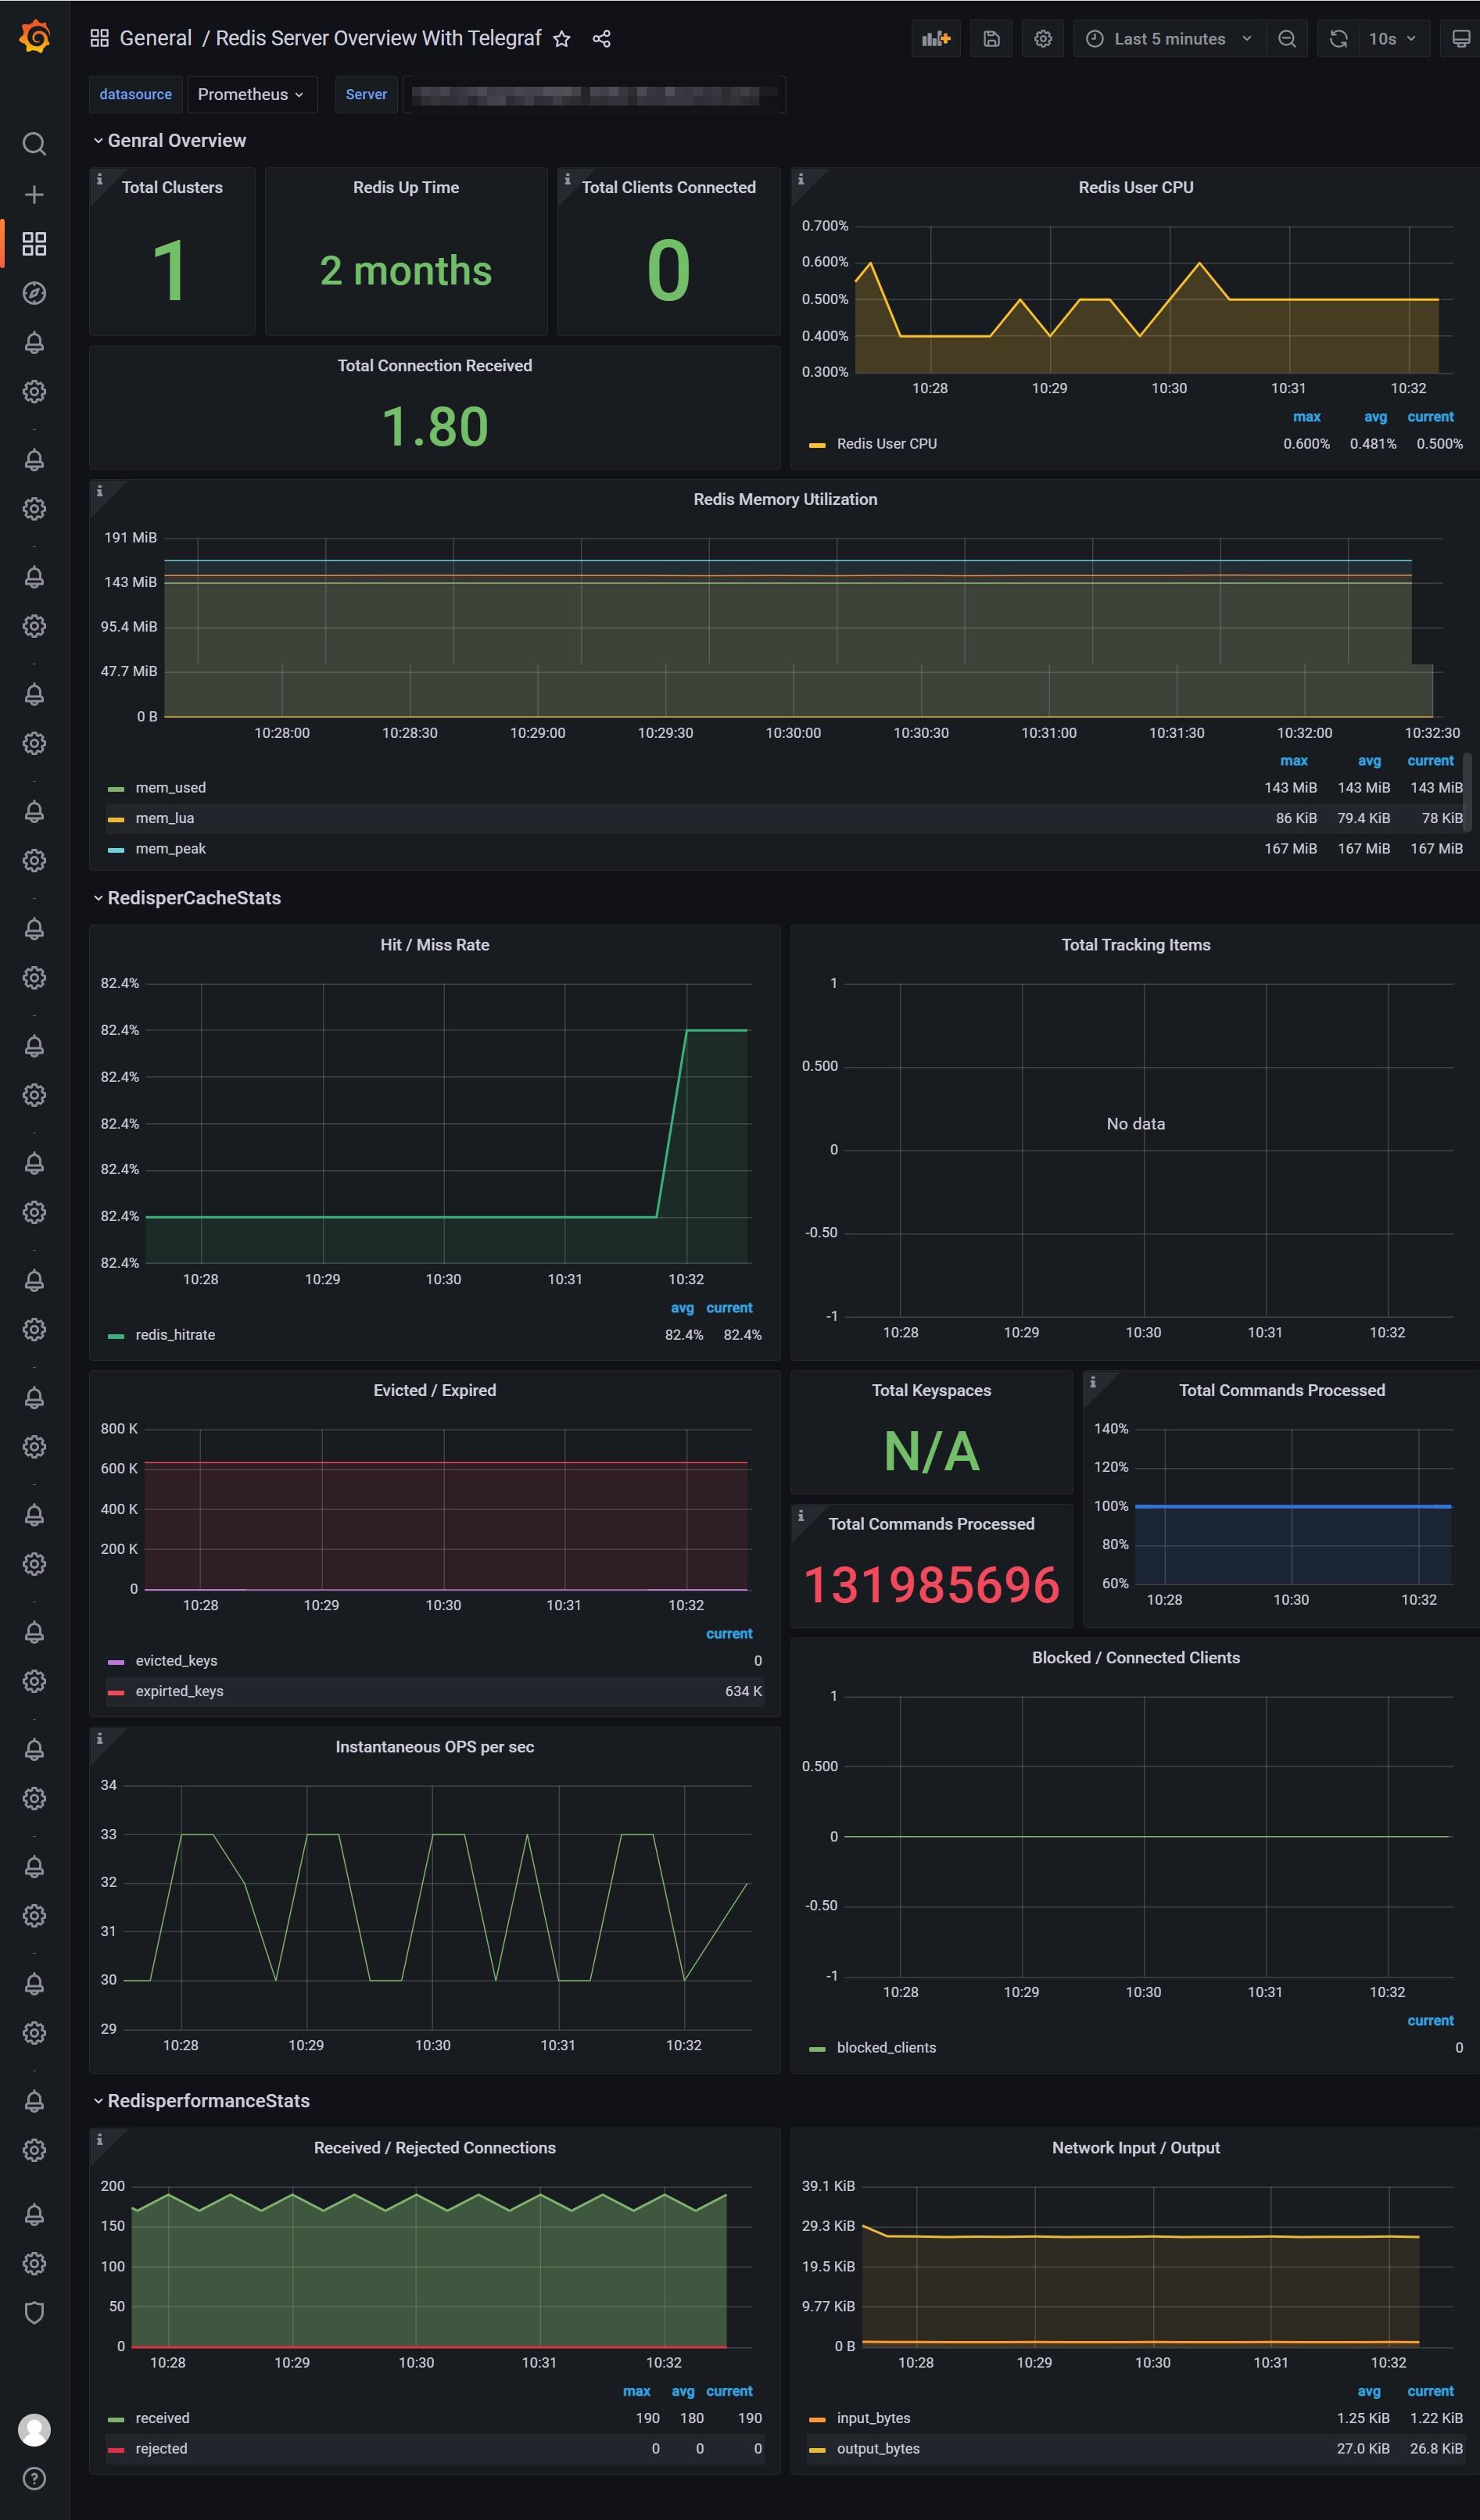
telegraf ---> n9e server ---> prometheus ---> grafana
Metrics include
- Uptime
- Total Cluster
- Total Clients Connected
- Cpu
- Memory
- Hit
- Network Traffic
Data source config
Collector type:
Collector plugins:
Collector config:
Revisions
Upload an updated version of an exported dashboard.json file from Grafana
| Revision | Description | Created | |
|---|---|---|---|
| Download |
Redis
Monitor Redis with Grafana. Easily monitor your Redis deployment with Grafana Cloud's out-of-the-box monitoring solution.
Learn more