Kubernetes / Views / K3s Cluster
Monitors K3s cluster using Prometheus Operator. Shows overall Cluster CPU / Memory / Cluster Filesystem usage (Longhorn, Ceph, ZFS ZVOLs, etc) as well as CPU, RAM and Network Statistics by Namespace and Node. Uses cAdvisor metrics.
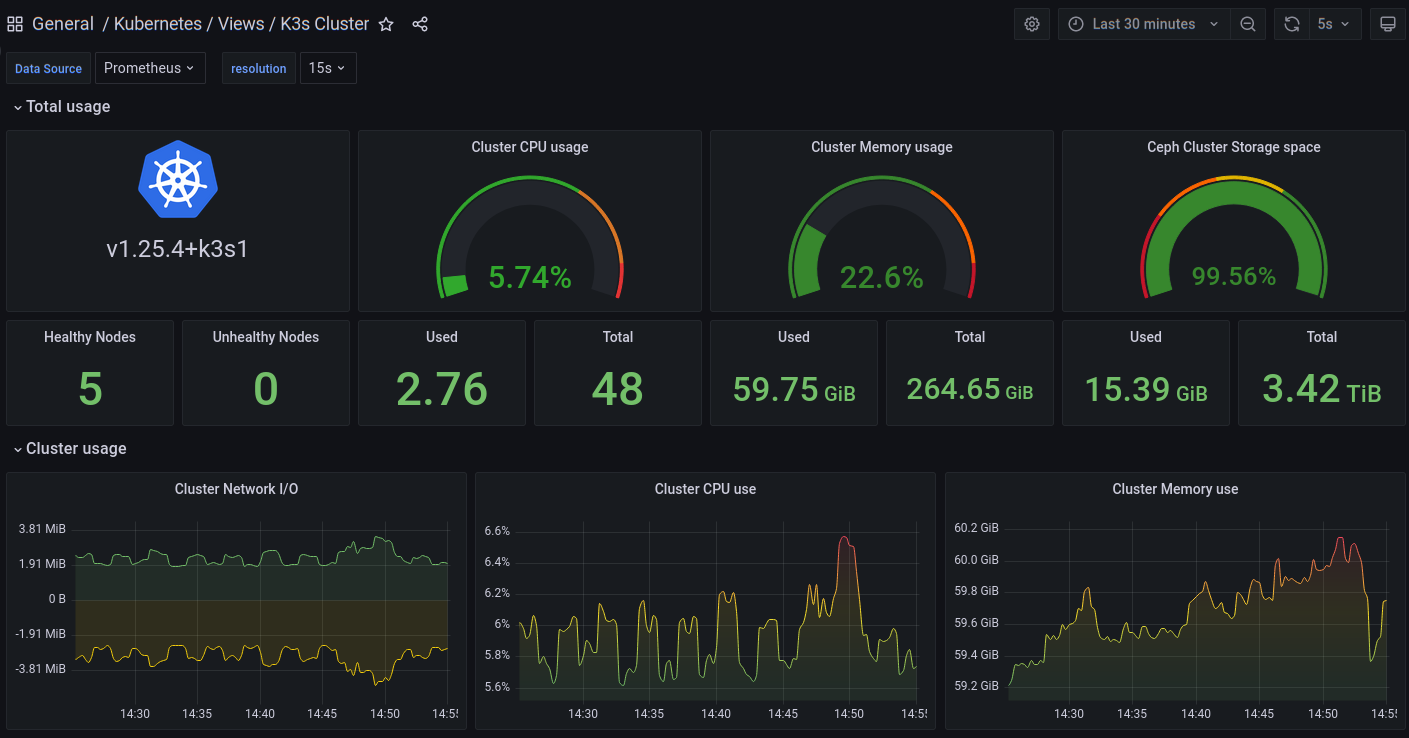
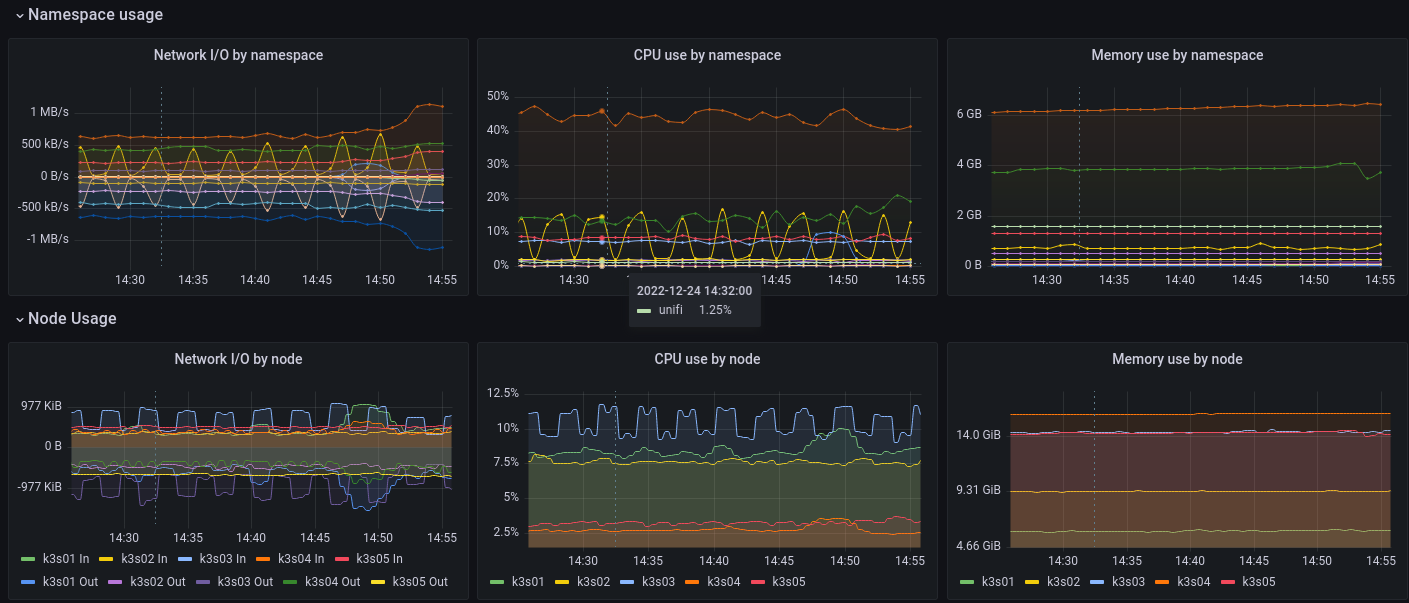
K3s compatible dashboard using cAdvisor metrics from Prometheus based on containerd (not docker) and a bit of Cluster Storage Space monitoring (you can edit to ZFS, Longhorn, Ceph, etc).
Designed to work with this project: https://github.com/reefland/ansible-k3s-argocd-renovate
Data source config
Collector config:
Upload an updated version of an exported dashboard.json file from Grafana
| Revision | Description | Created | |
|---|---|---|---|
| Download |
Kubernetes
Monitor your Kubernetes deployment with prebuilt visualizations that allow you to drill down from a high-level cluster overview to pod-specific details in minutes.
Learn more