Telegraf System Dashboard
Telegraf host metrics dashboard with TDengine grafana plugin.
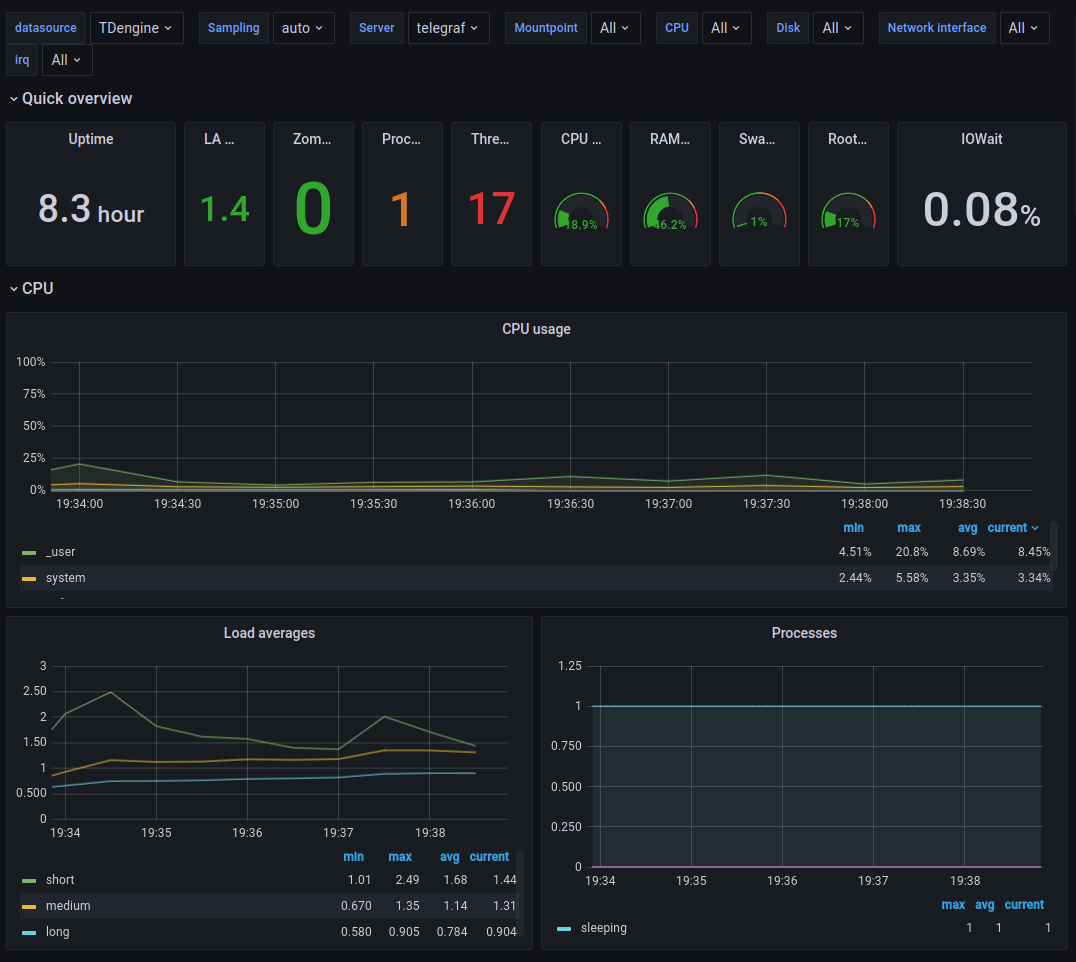
Telegraf Dashboard with TDengine
This an example project to show the how Telegraf + TDengine + Grafana works together.
The telegraf dashboard comes from the top 1 downloaded dashboard - which downloaded 21k times - with InfluxDB data source, completely ported to TDengine with its data source plugin.

Setup
Checkout the examples/telegraf directory to see how to setup Telegraf + TDengine + Grafana in a docker-compose file.
Data source config
Collector type:
Collector plugins:
Collector config:
Revisions
Upload an updated version of an exported dashboard.json file from Grafana
| Revision | Description | Created | |
|---|---|---|---|
| Download |