
Azure MySQL Flexible Server Monitor
Azure Database Server for MySQL Flexible Server, metrics via Azure Monitor and MySQL Performance Schema
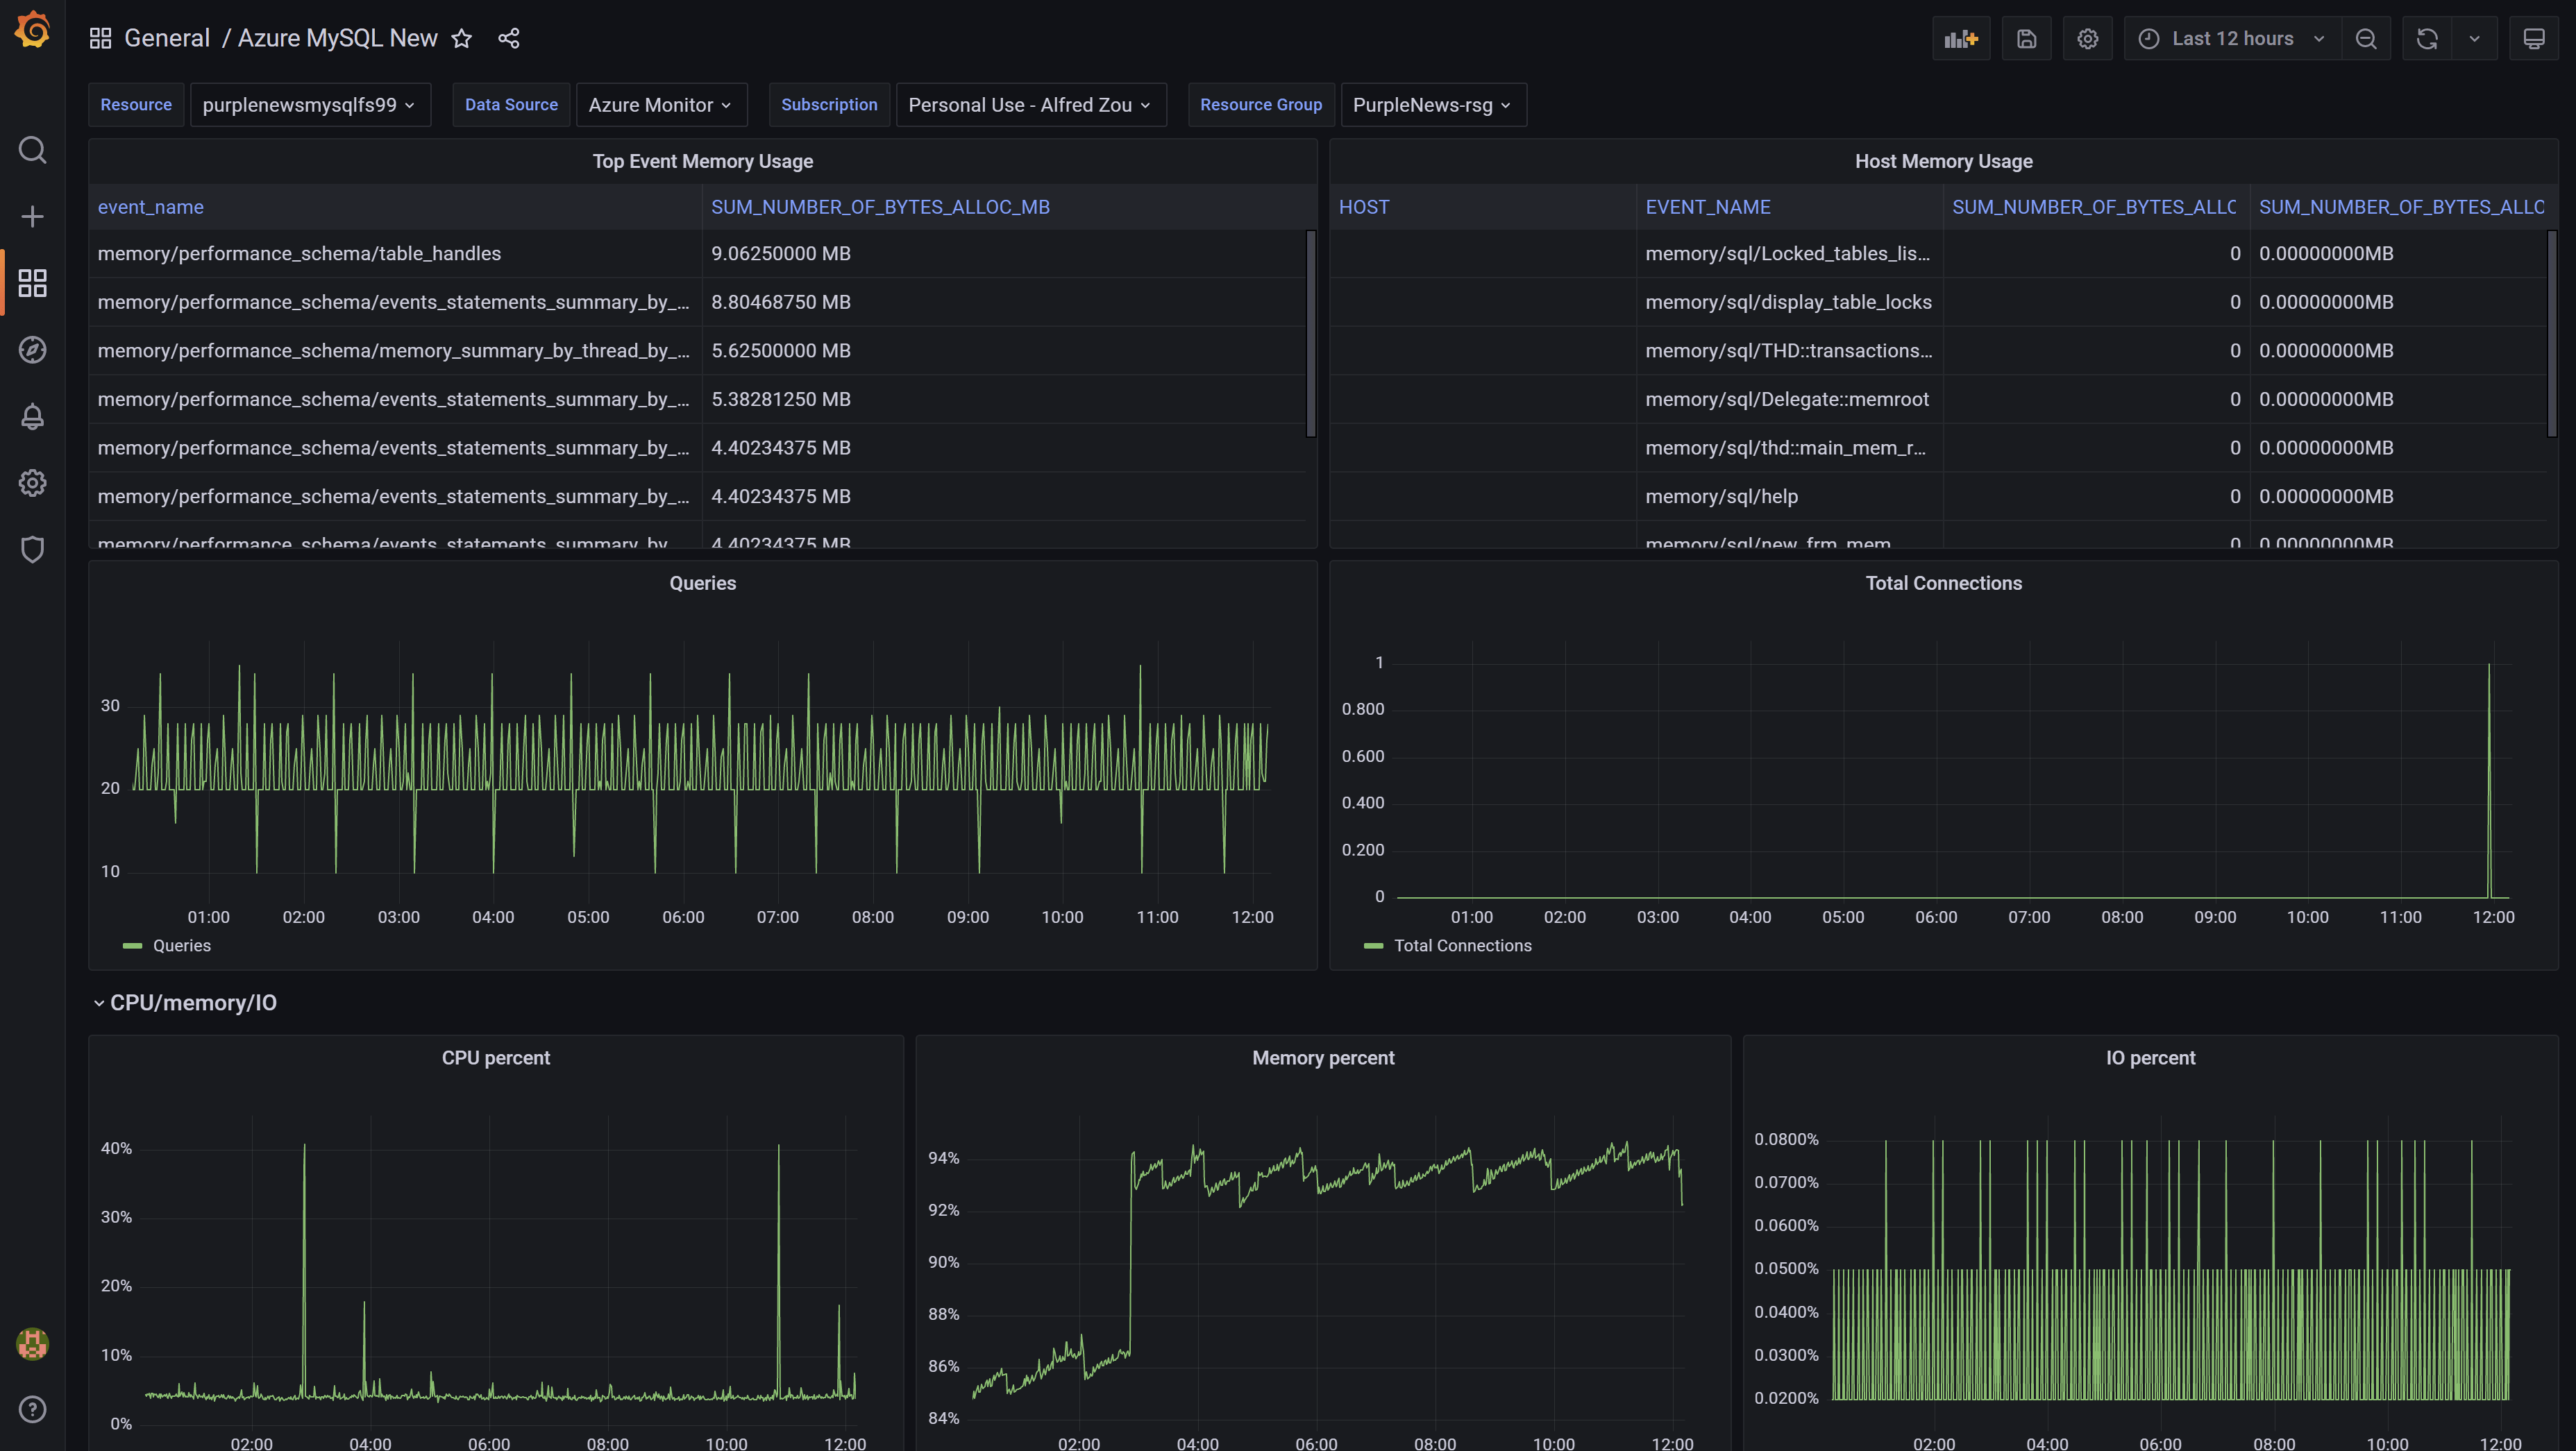
The Azure MySQL Flexible Server Monitor dashboard uses the grafana-azure-monitor-datasource and mysql data sources to create a Grafana dashboard with the table and timeseries panels.
Data source config
Collector type:
Collector plugins:
Collector config:
Revisions
Upload an updated version of an exported dashboard.json file from Grafana
| Revision | Description | Created | |
|---|---|---|---|
| Download |

Azure Cosmos DB

With the Grafana plugin for Azure Cosmos DB, you can quickly visualize and query your Azure Cosmos DB data from within Grafana.
Learn more