InfluxDB Internal - System Snapshot
Robust Grafana dashboard for InfluxDB. Leverages the _internal InfluxDB database to create the perfect snapshot of a variety of internal InfluxDB metrics.
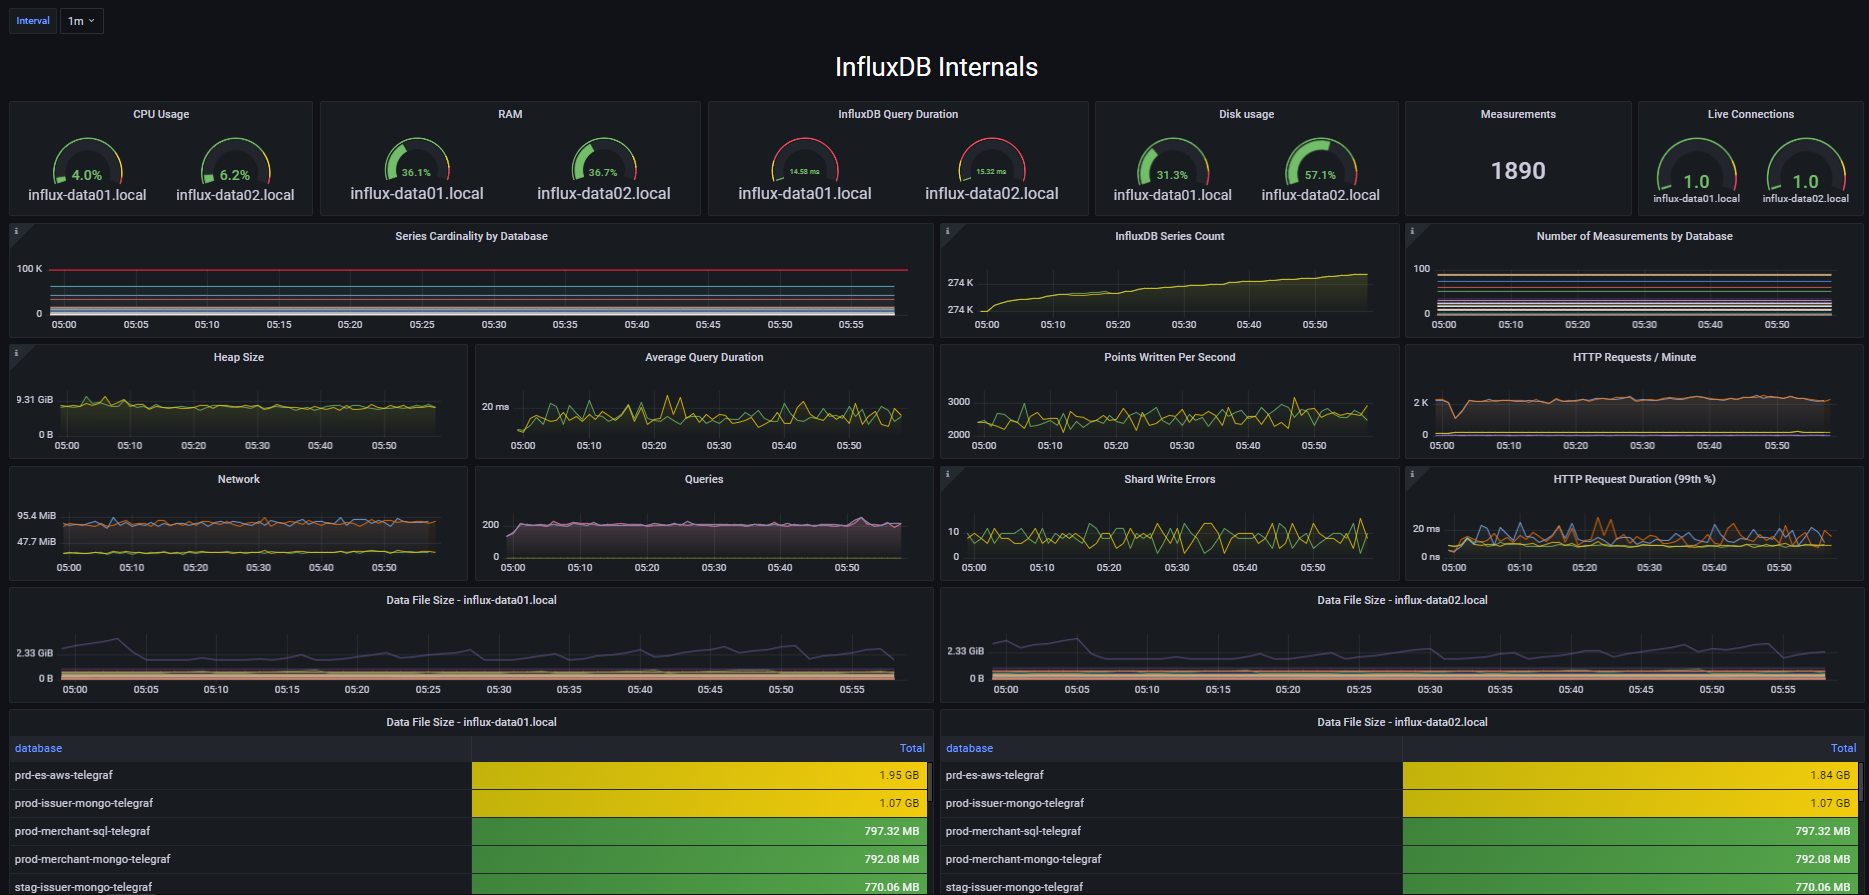
Leverages the _internal InfluxDB database and OS metrics to provide statistics about RAM, CPU, memory, series cardinality, measurement count, query duration, database size, HTTP requests, and records per second.
InfluxDB Enterprise v1.8+ Grafana 8.5+
Visualization Types
- Guage
- Time Series
- Singlestat
- Table
- Text
Transformations
- Group by
- Sort by
Data source config
Collector type:
Collector plugins:
Collector config:
Revisions
Upload an updated version of an exported dashboard.json file from Grafana
| Revision | Description | Created | |
|---|---|---|---|
| Download |
InfluxDB
Easily monitor InfluxDB, an open source time series database, with Grafana Cloud's out-of-the-box monitoring solution.
Learn more