AWS NAT Gateway
AWS NAT Gateway metrics
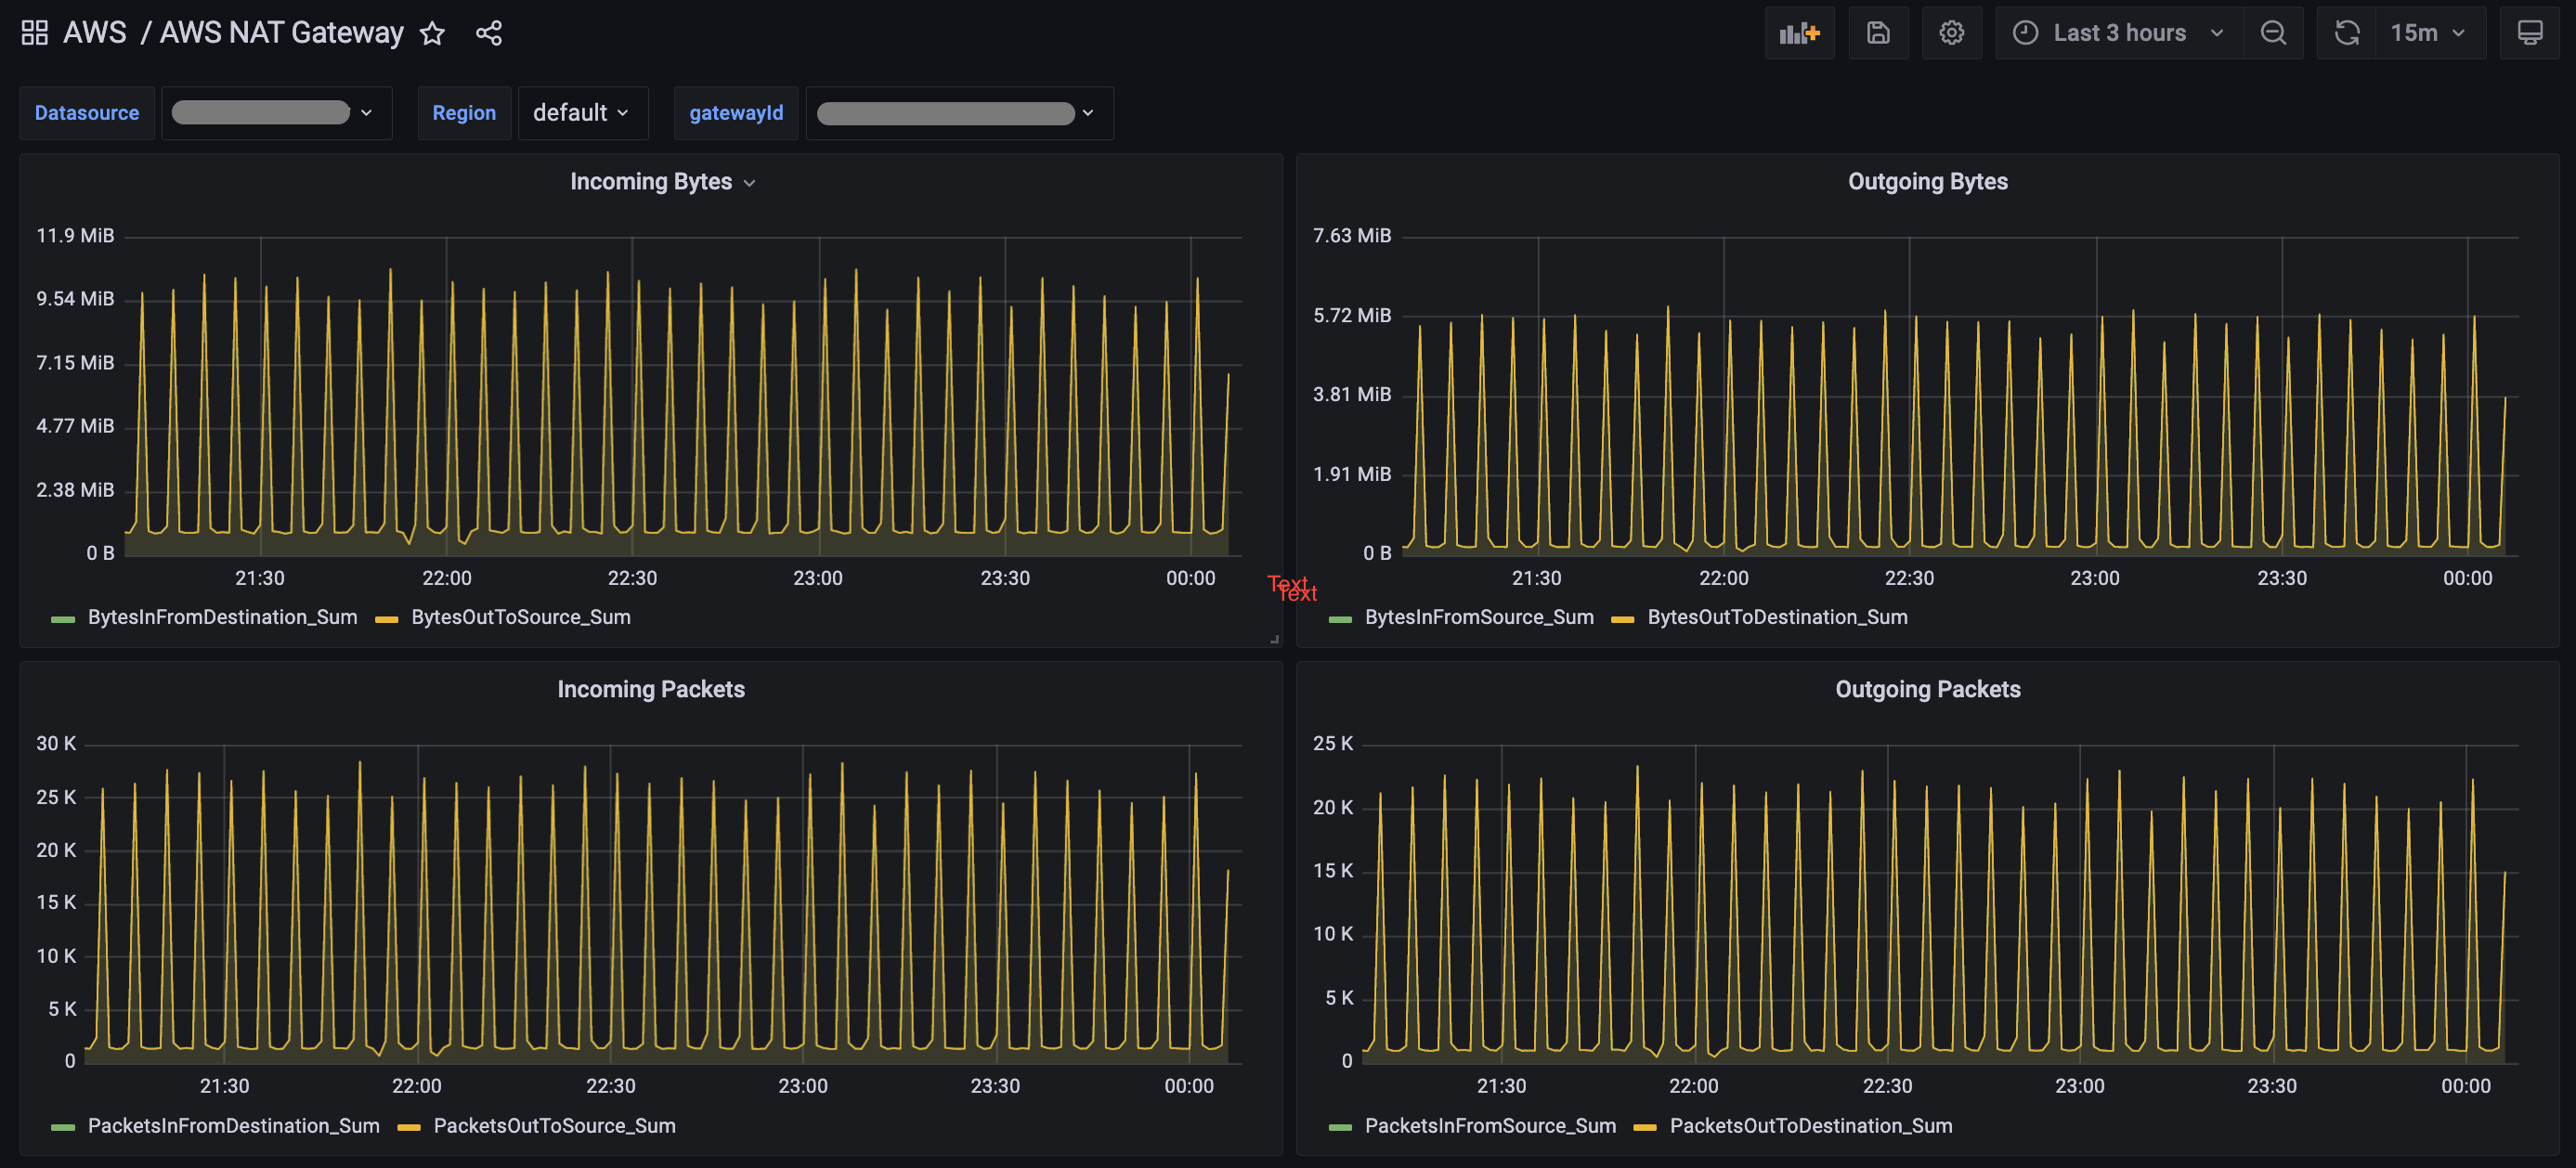
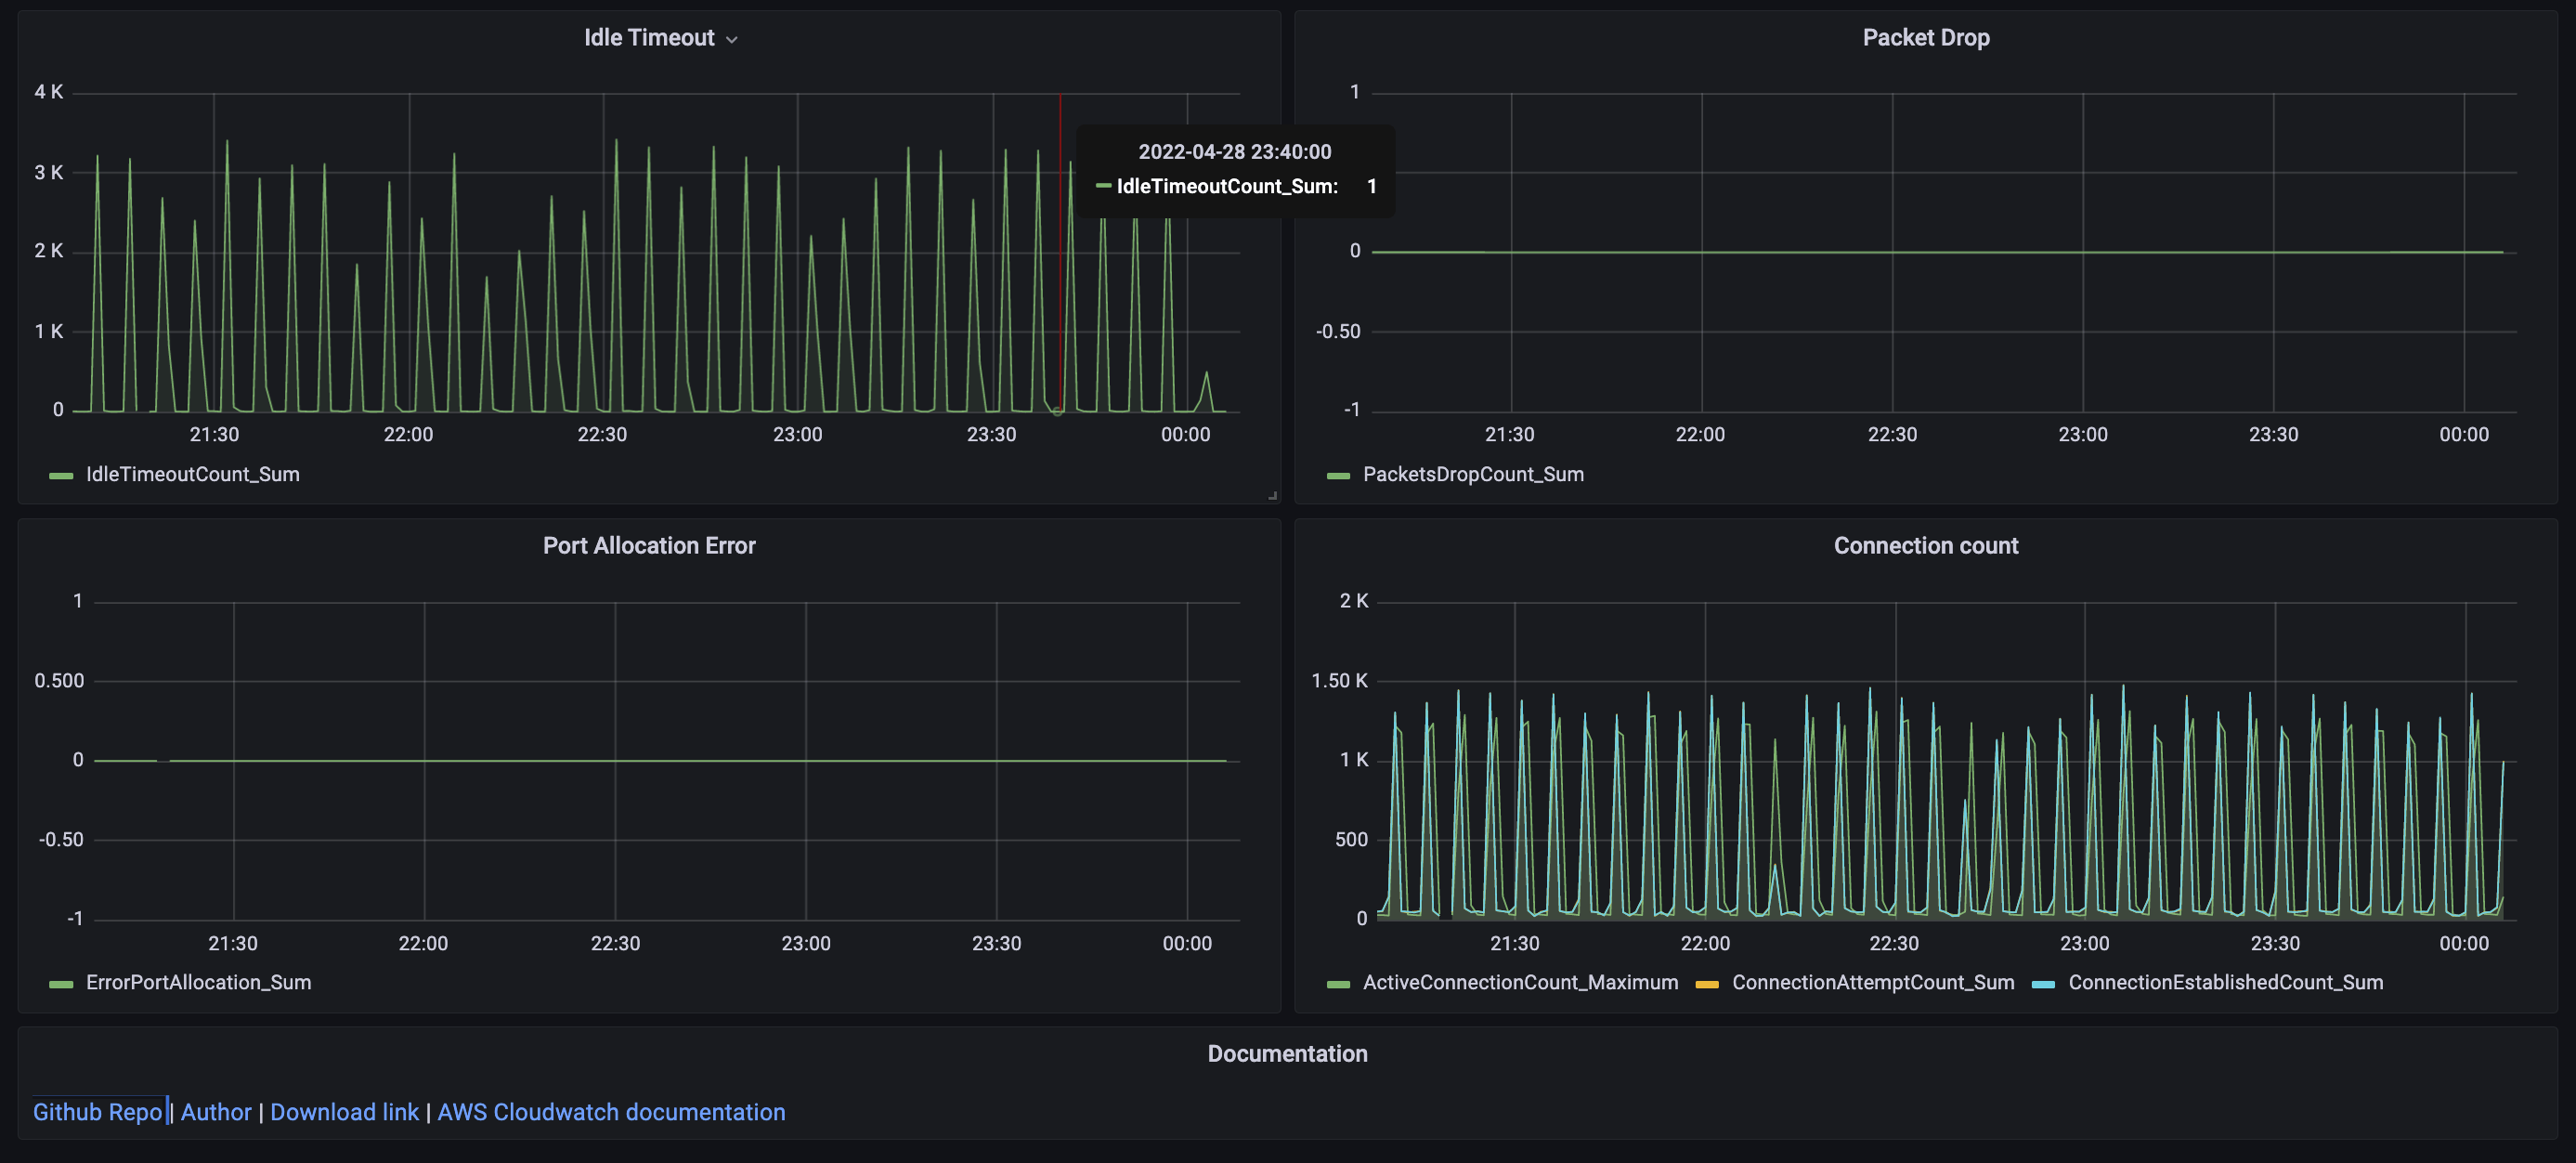
This dashboard shows the NAT Gateway metrics from CloudWatch.
- Text panel
- Graph Panel
- Permission to read CloudWatch metrics from AWS
Note: The dashboard uses CloudWatch queries to fetch metrics. This incurs cost on the AWS account, so it is advised to set a higher refresh interval on the dashboard.
Data source config
Collector type:
Collector plugins:
Collector config:
Revisions
Upload an updated version of an exported dashboard.json file from Grafana
| Revision | Description | Created | |
|---|---|---|---|
| Download |
AWS
Easily visualize and alert on more than 60 Amazon Web Services (AWS) resources using the fully managed Grafana Cloud platform.
Learn more