opstree/Rabbitmq Dashboard
Rabbitmq stats and alerting using RabbitMQ Exporter (https://github.com/kbudde/rabbitmq_exporter)
RabbitMQ Dashboard will fetch the metrics through the exporter that is deployed on the k8’s cluster.
Installation Steps For RabbitMQ Node Exporter Using Helm
- helm repo add prometheus-community https://prometheus-community.github.io/helm-charts
- helm show values prometheus-community/prometheus-rabbitmq-exporter > rabbitexp_values.yaml
- Inside rabbitexp_values.yaml Please make the below changes
rabbitmq:
 Url: http://RABBITMQ.URL:15672 (#Add rabbitmq URL here)
 user: user (#Add username of RabbitMQ)
 password: guest (#we can add Password here or we can give Secret reference below)
If existingPasswordSecret is set then password will be ignored
existingPasswordSecret: rabbitmq (#Add secret name of RabbitMQ which contain password)
existingPasswordSecretKey: rabbitmq-password
For installation of RabbitMQ on Server Please use the exporter: https://github.com/kbudde/rabbitmq_exporter
Prometheus configuration
scrape_configs:
  - job_name: 'RabbitMQ’
    static_configs:
      - targets: ['x.x.x.x:9419']
    relabel_configs:
      - source_labels: [__address__]
        target_label: instance
        regex: '.*'
        replacement: 'RabbiMQ_Server’
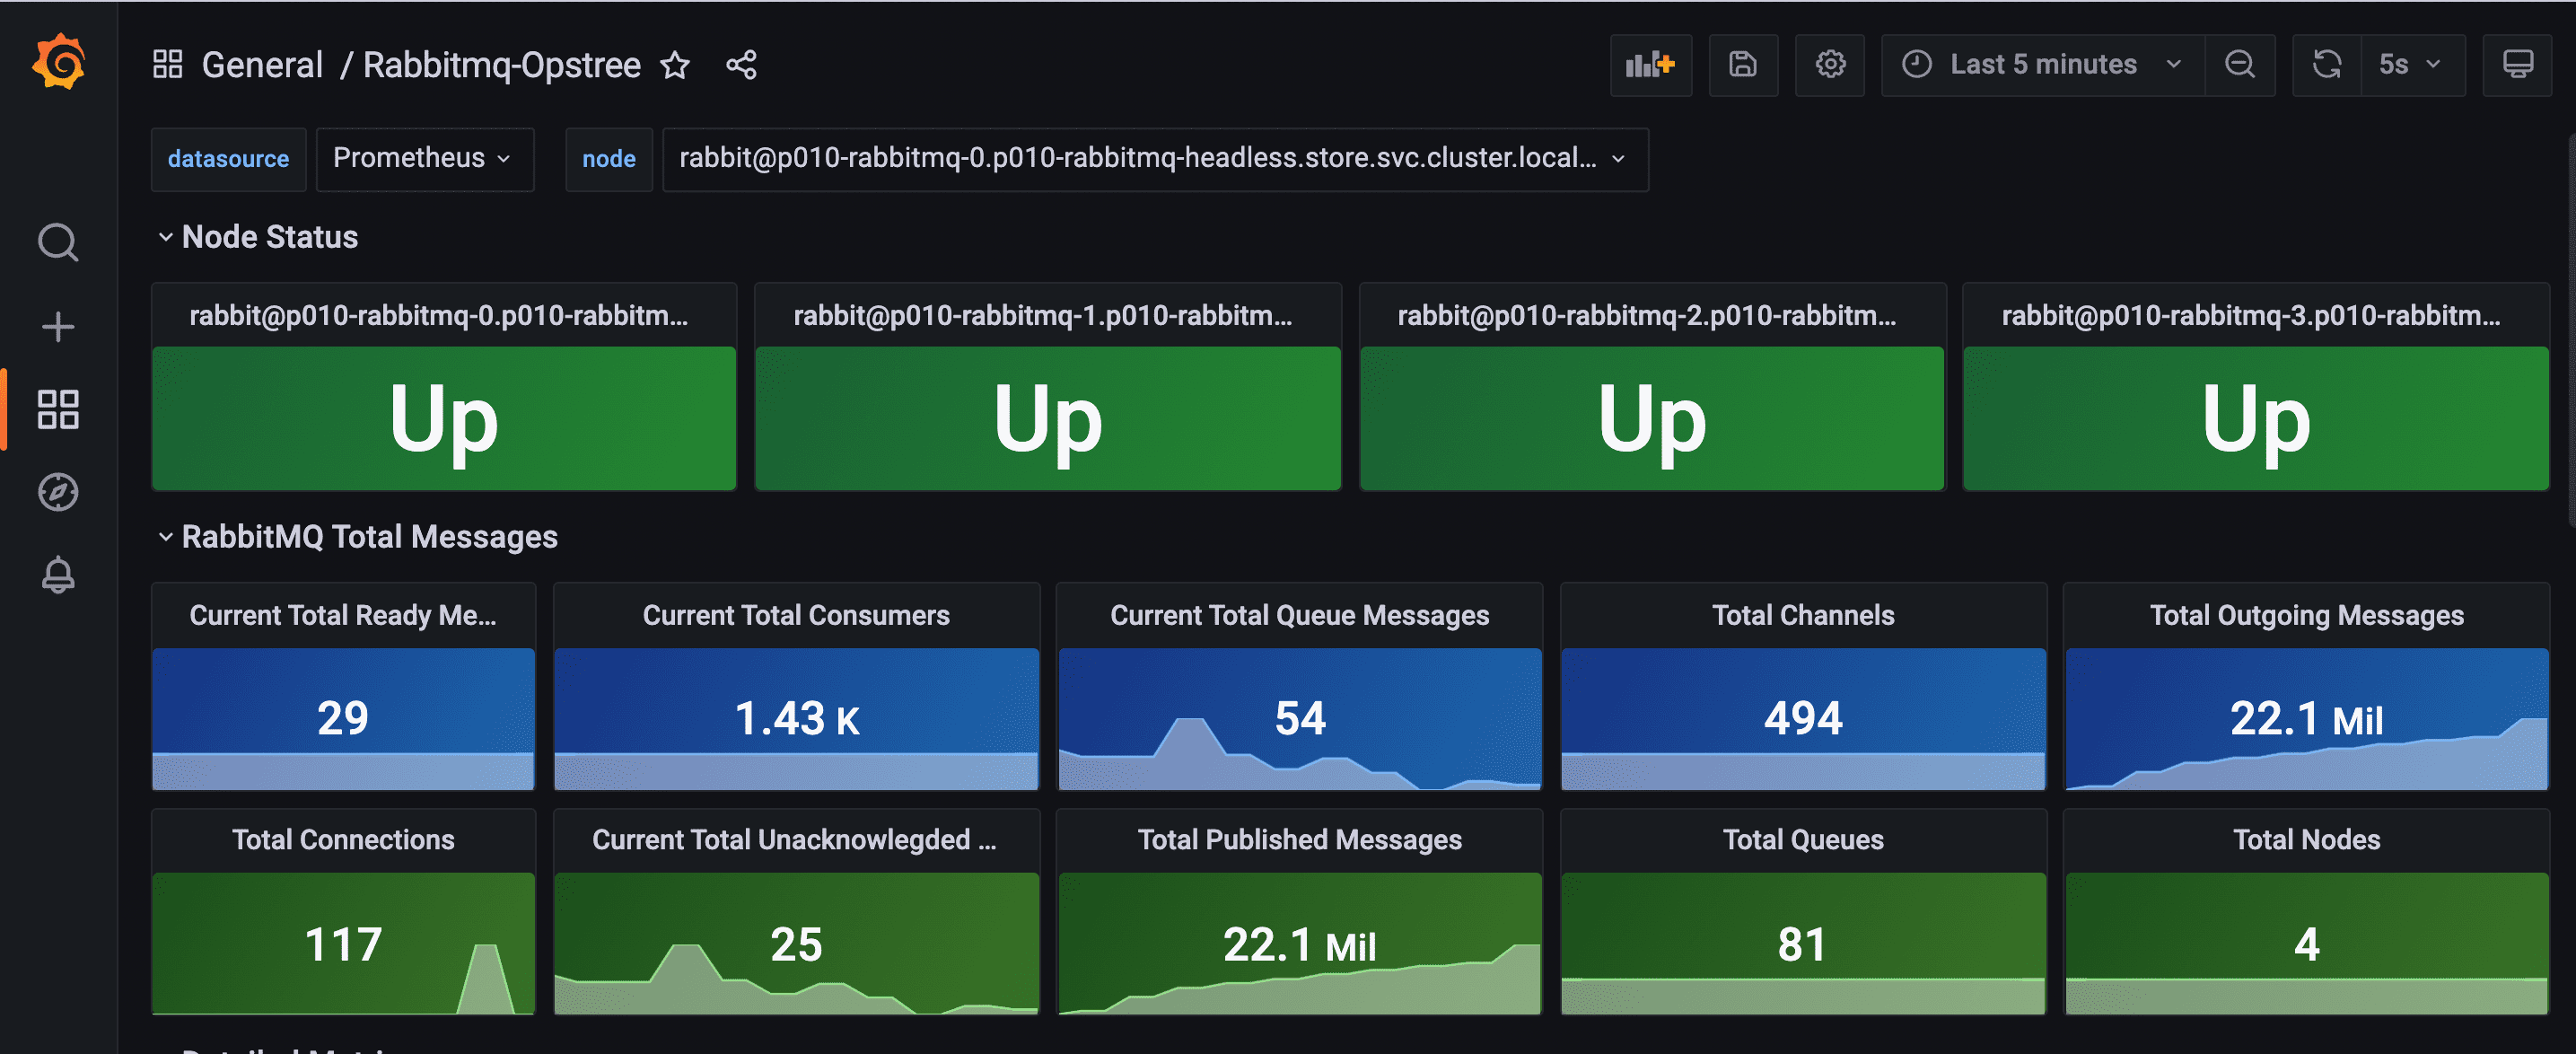
Metrics we are monitoring
- Nodes Status
- Uptime
- Current Total Ready Messages
- Current Total Consumers
- Current Total Queue Messages
- Total Channels
- Total Outgoing Messages
- Total Connections
- Current Total Unacknowledged Message
- Total Exchanges
- Total Queues
- Total Published Messages
- Total Nodes
- Messages per Queue
- Messages per Consumer
- Messages status
- Connections, channels and consumers
- Disk free
- Memory Usage
Contributor Information
Data source config
Collector type:
Collector plugins:
Collector config:
Revisions
Upload an updated version of an exported dashboard.json file from Grafana
| Revision | Description | Created | |
|---|---|---|---|
| Download |