opstree/Redis Dashboard
Redis Dashboard
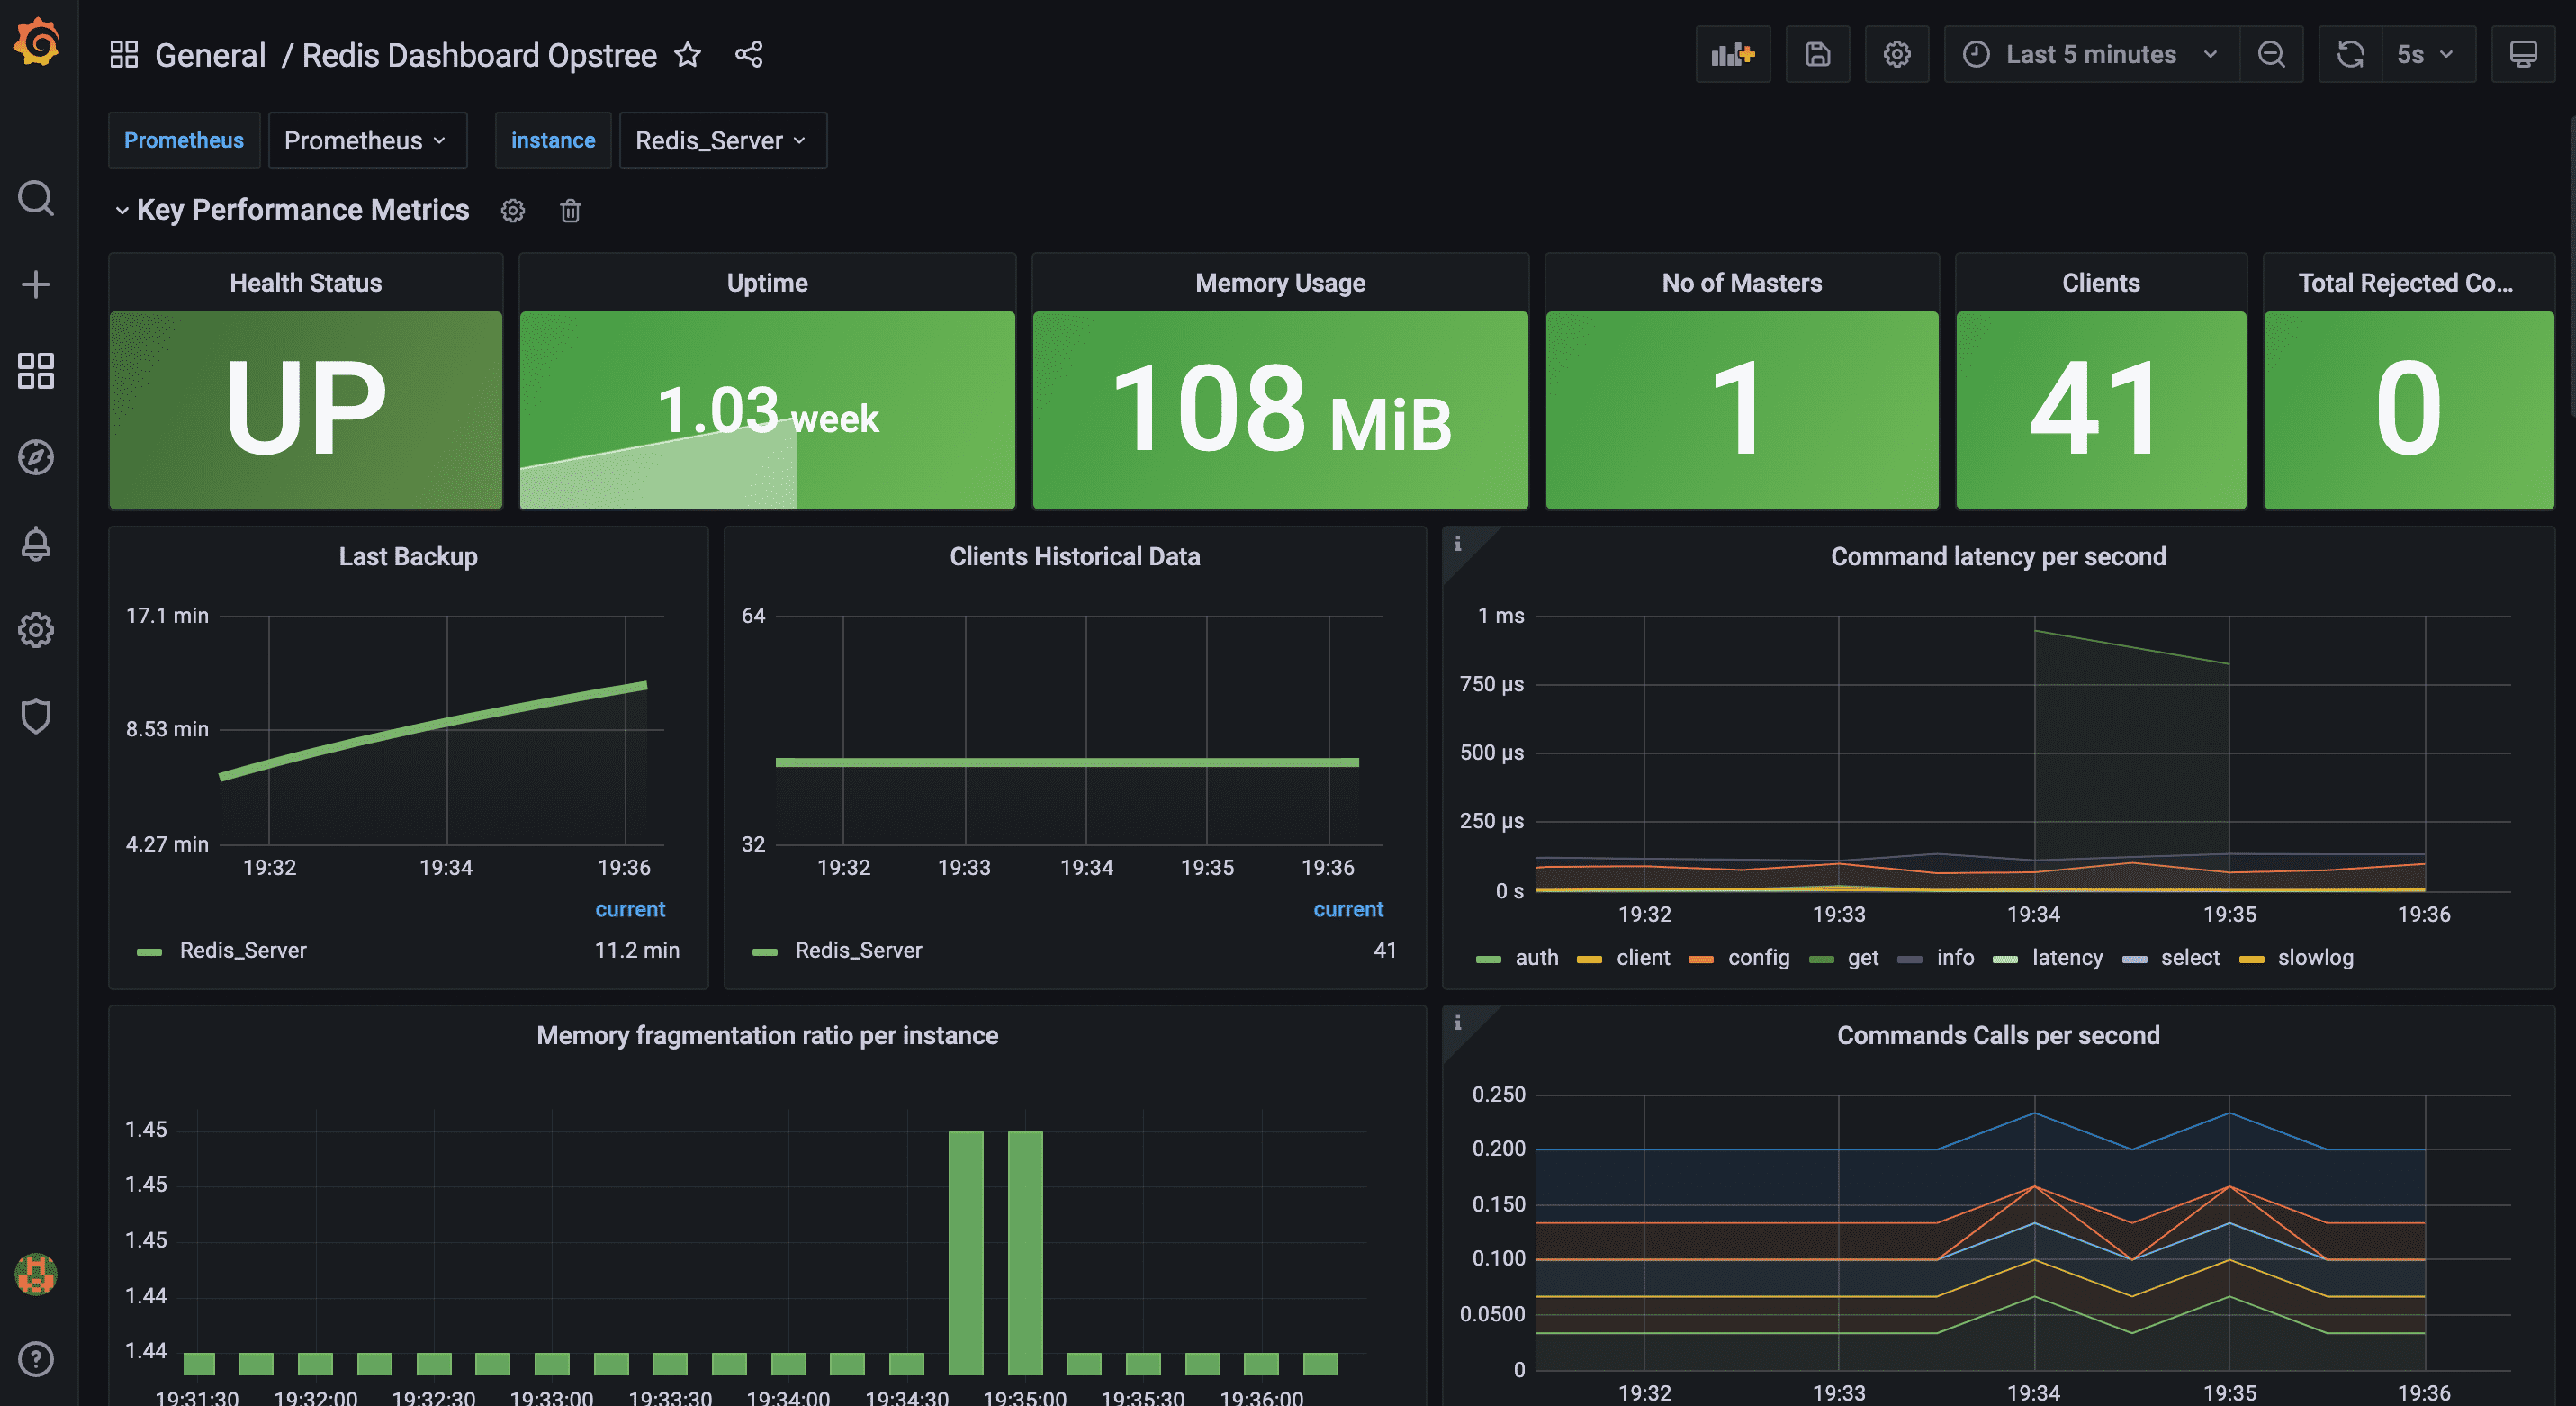
The Redis dashboard will display data collected by the Prometheus redis_exporter.
Prometheus configuration
scrape_configs:
  - job_name: 'Redis'
    static_configs:
      - targets: ['x.x.x.x:9121']
    relabel_configs:
      - source_labels: [__address__]
        target_label: instance
        regex: '.*'
        replacement: 'Redis_Server’
Metrics we are monitoring
- Health Status
- Uptime
- Memory Usage
- No of Masters
- Clients
- Total Rejected Connections
- Last Backup
- Clients Historical Data
- Command latency per second
- Memory Fragmentation Ratio per instance
- Command Calls per second
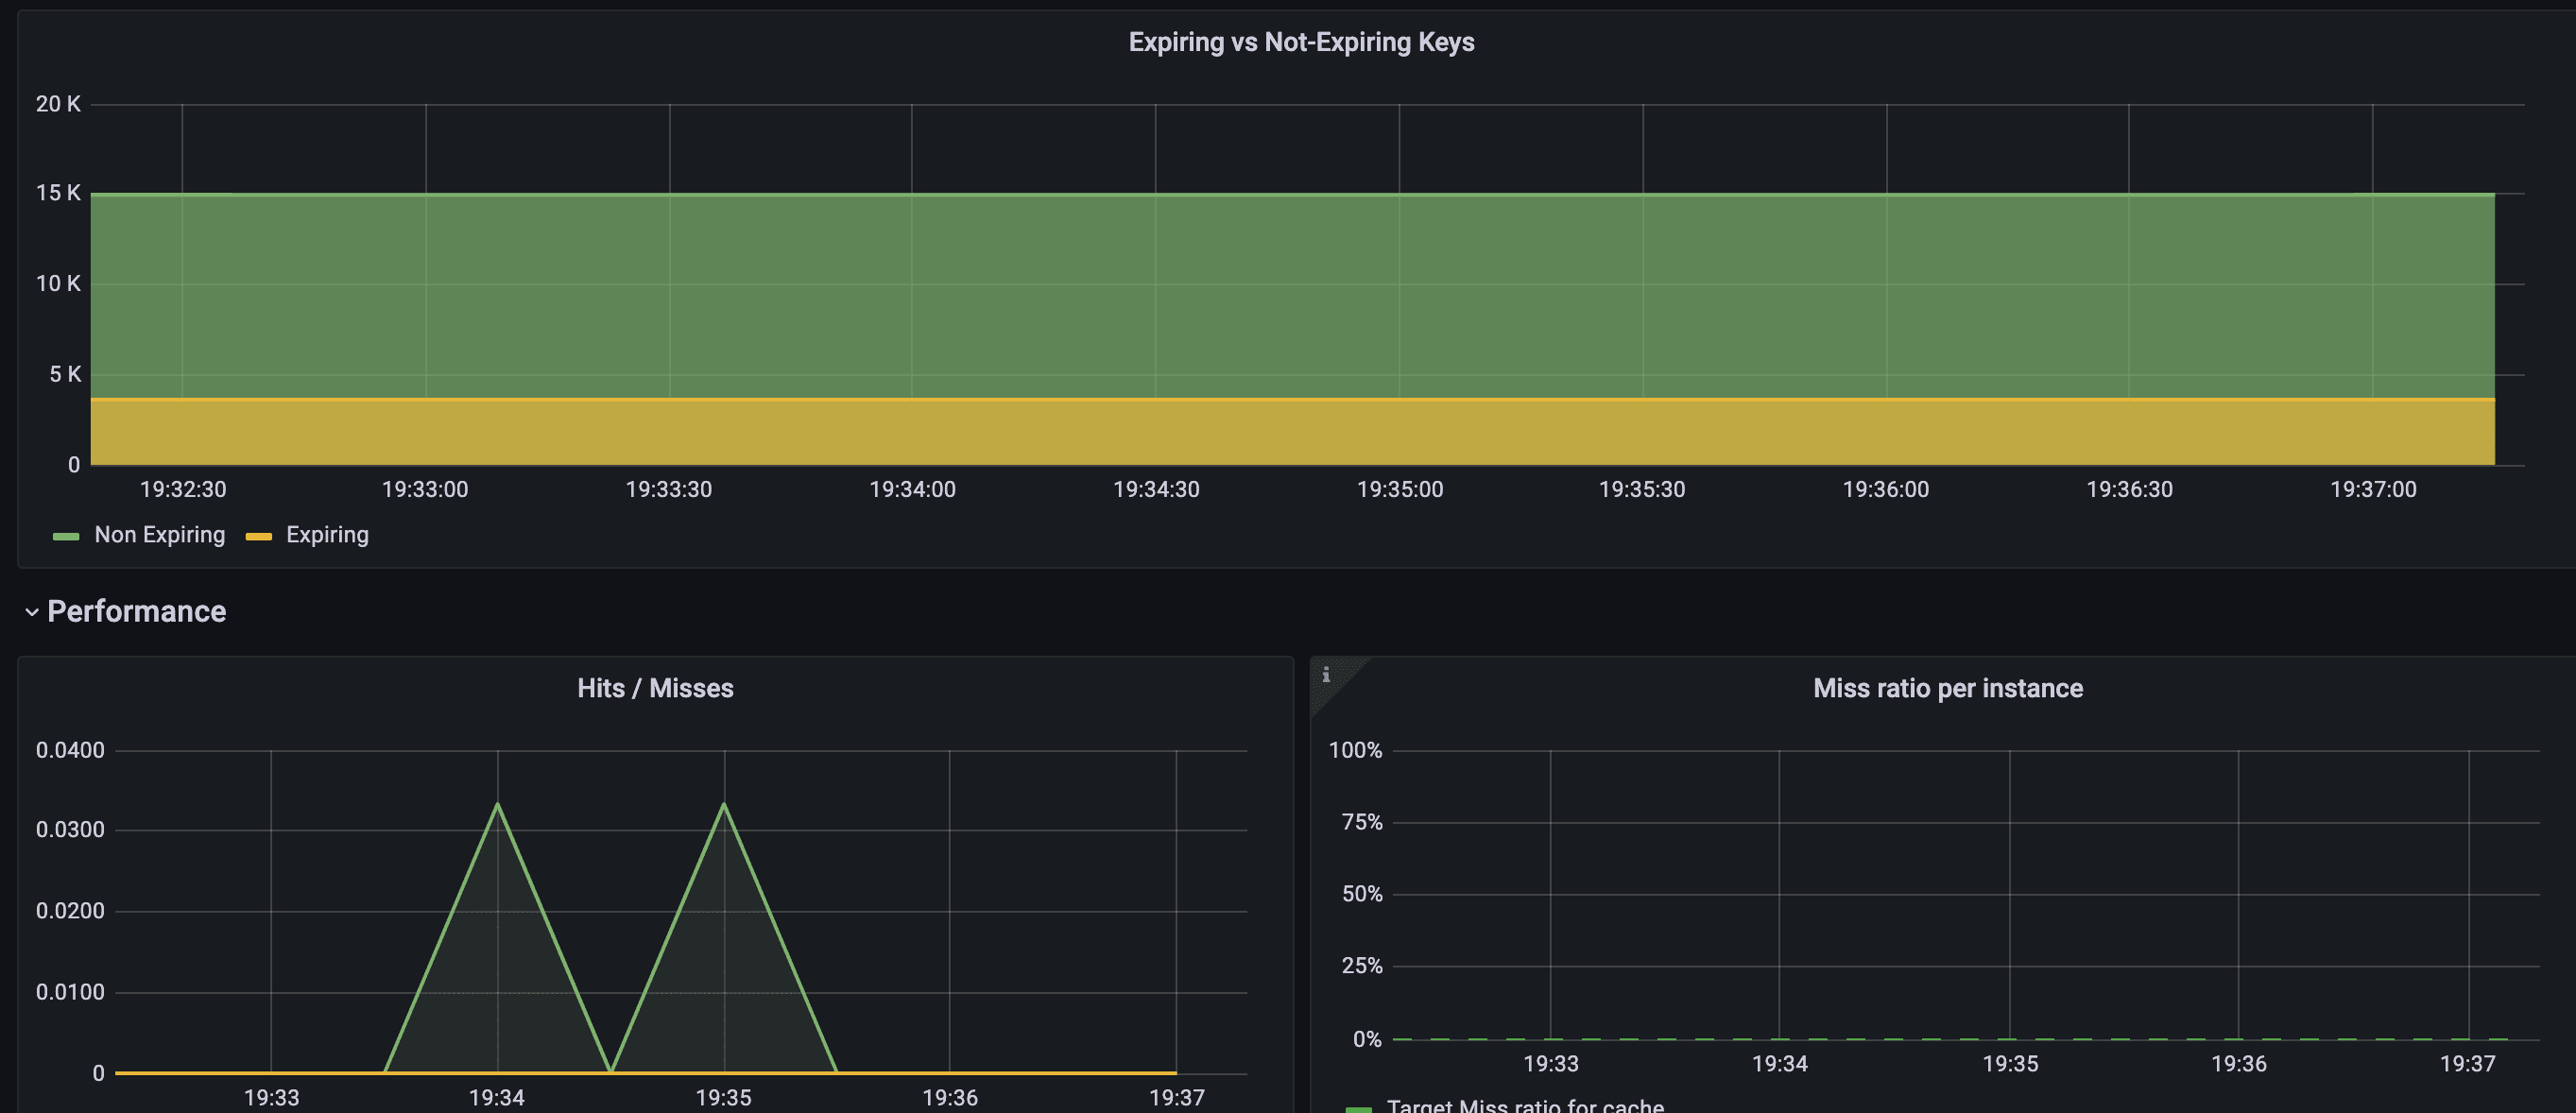
- Expiring vs Not-Expiring Keys
- Hiss/Misses
- Miss ratio Per instance
- Hit Ratio Per instance
- Command Executed Per Second
- Command Calls Per Second
- Connected Slaves
- Total Connection Received
- Network in & Out
- Redis Replication
- Total Memory Usage
- Key Evicted
- Total Items per DB
Contributor Information
Data source config
Collector type:
Collector plugins:
Collector config:
Revisions
Upload an updated version of an exported dashboard.json file from Grafana
| Revision | Description | Created | |
|---|---|---|---|
| Download |